2025 Crop Tour Schedule | Frequently Asked Questions.
The Pro Farmer Crop Tour’s primary goal is to provide the industry with accurate growing season information about likely corn and soybean yields at the state and regional levels during the upcoming harvest season.
Crop Tour’s data-gathering methods are disciplined and produce consistent results. Results from the Tour have a big impact on Pro Farmer Newsletter’s annual crop production estimate released at week’s end. But observations gathered during the Tour can be just as important as the data itself.
“We pull enough samples to provide us with accurate data for a large geographic area. The Pro Farmer Crop Tour does not attempt to predict actual yields for individual fields or even a county, but we do want to have a good handle on likely yields for each of the seven states we survey,” says Pro Farmer’s Lane Akre.
Pro Farmer Crop Tour Strives to Stay “Consistently Random.”
The Tour stays consistent by traveling the third week of August every year, by traveling the same routes every year and by using the same sampling procedure in every field.
The randomness of the Tour is actually “planned randomness.” It’s achieved by not predetermining which fields will be sampled and by allowing each team to select the location in the field. But it doesn’t end there: More planned randomness is added by walking 35 paces down the main rows to the sample location. (When scouts start walking into a corn field, there’s no way to tell what will be about 35 yards beyond the end rows.) Even the ear selection is consistently random. By pulling the fifth, eighth and 11th ear from one sample row, scouts might pull the three best, or three worst, ears from the row.
That’s a lot of investigation … but how do you use it? There is only one way to use data collected on the Pro Farmer Crop Tour—compare the current results to past Tours. That comparison has proven to yield the most reliable analysis of fresh data.
We’ve studied and analyzed thousands of samples over 30 years of touring, and we’ve calculated the “historical error” of the Tour data. Simply put, we know the Tour results will be different than USDA’s final yield estimate for each state. Fortunately, we know which states the Tour measures “high” or “low,” and we know, on average, by how much. That allows us to adjust Tour results to produce a more reliable yield estimate when the Pro Farmer crop estimates are released following completion of the Tour.
When you hear results from the Tour, don’t just compare them to USDA’s August Crop Production report. Compare Tour results to the previous year’s results to figure how much bigger or smaller average yields will be.
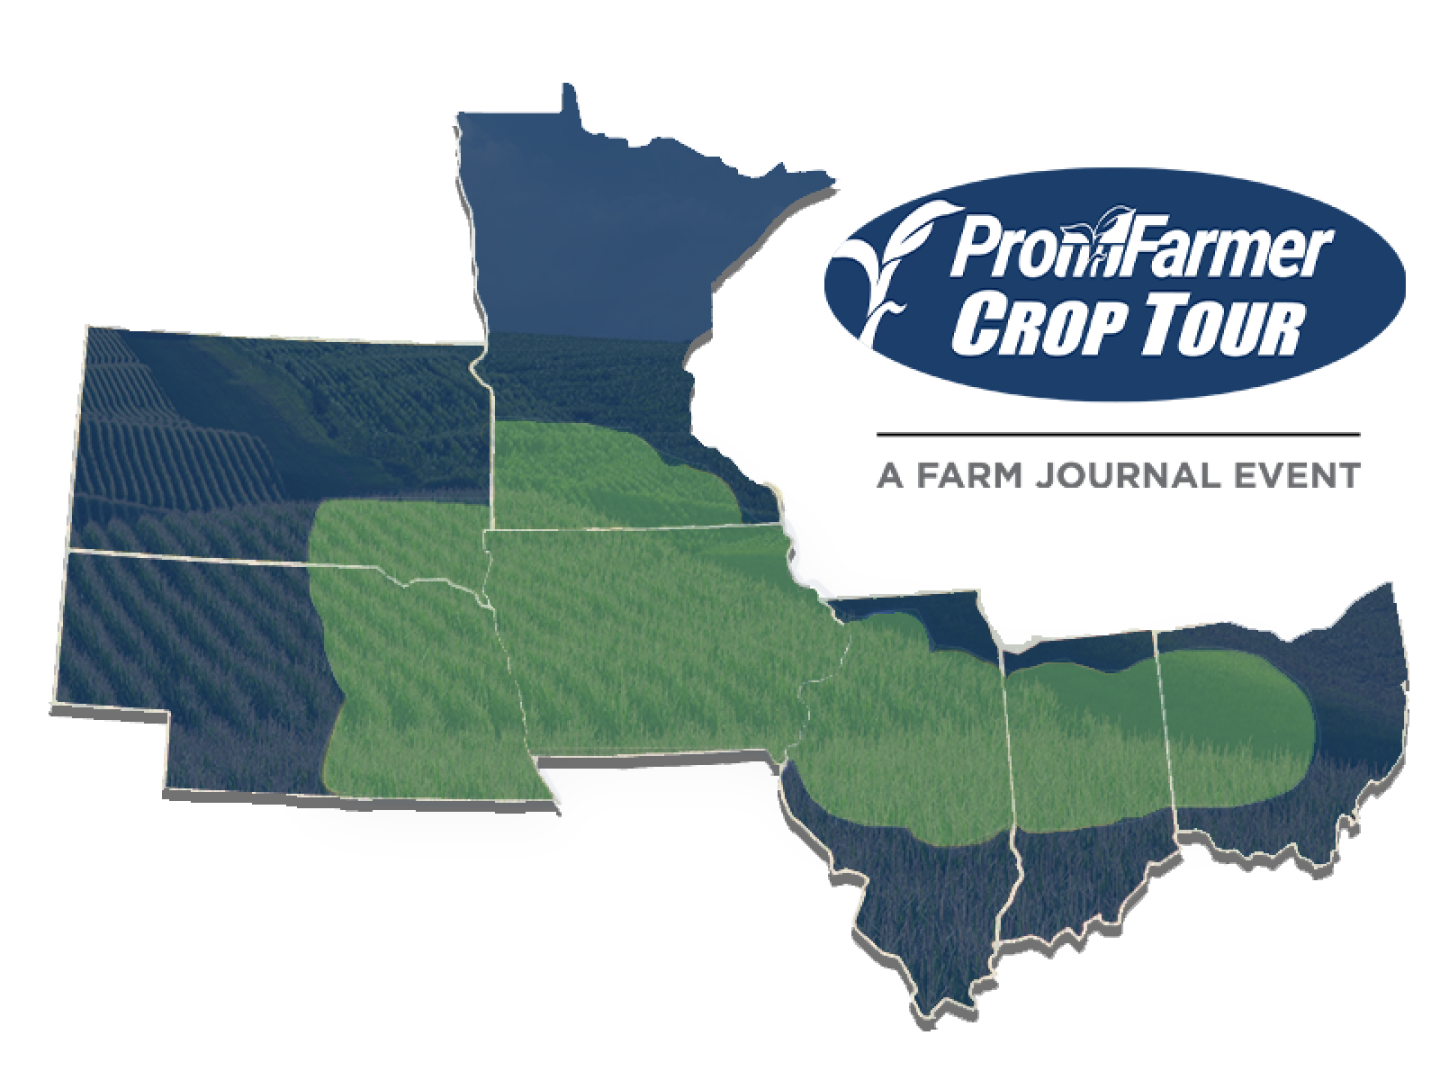
Pro Farmer has been conducting the Midwest Crop Tour since 1993. Early Tours focused on Illinois, Indiana, Iowa, Minnesota and Ohio, with Nebraska and South Dakota added in 1998. Together, the seven states that make up the Tour account for about 70% of our nation’s corn and soybean production.


