Grain and oilseed markets remain volatile as President Donald Trump and Chinese leader Xi Jinping prepare to meet this week in a bid to iron out trade differences.
The spotlight has been on soybeans, which have rallied after officials touted a framework agreement that bulls hope will see China resume purchases after shunning the U.S. so far this marketing year.
Since their initial ending stocks forecast of 295 million bushels in May, USDA has maintained a relatively tight soybean balance sheet for the past several months, ranging upwards of 310 million bushels and down to 290 million bushels. Exports to all destinations started the marketing year at 1,815 million bushels and the latest forecast (from September) pegged exports at 1,685 million bushels.
The market has done little to price in relatively tight stocks, apparently balking at USDA’s estimates, assuming exports would be lower and ending stocks higher. That helps explain why prices remain near multi-year lows despite ending stocks and stocks-to-use at the tightest mark since 2022-23, when prices were around 40% higher.
University of Illinois ag economics professor Scott Irwin in a post last week estimated what exports could look like if China remained absent from the U.S. market. Ultimately, he found that even if China stays away, USDA’s forecast for the 2025-26 marketing year remains achievable as world’s exportable surplus remains relatively tight when compared to import demand.
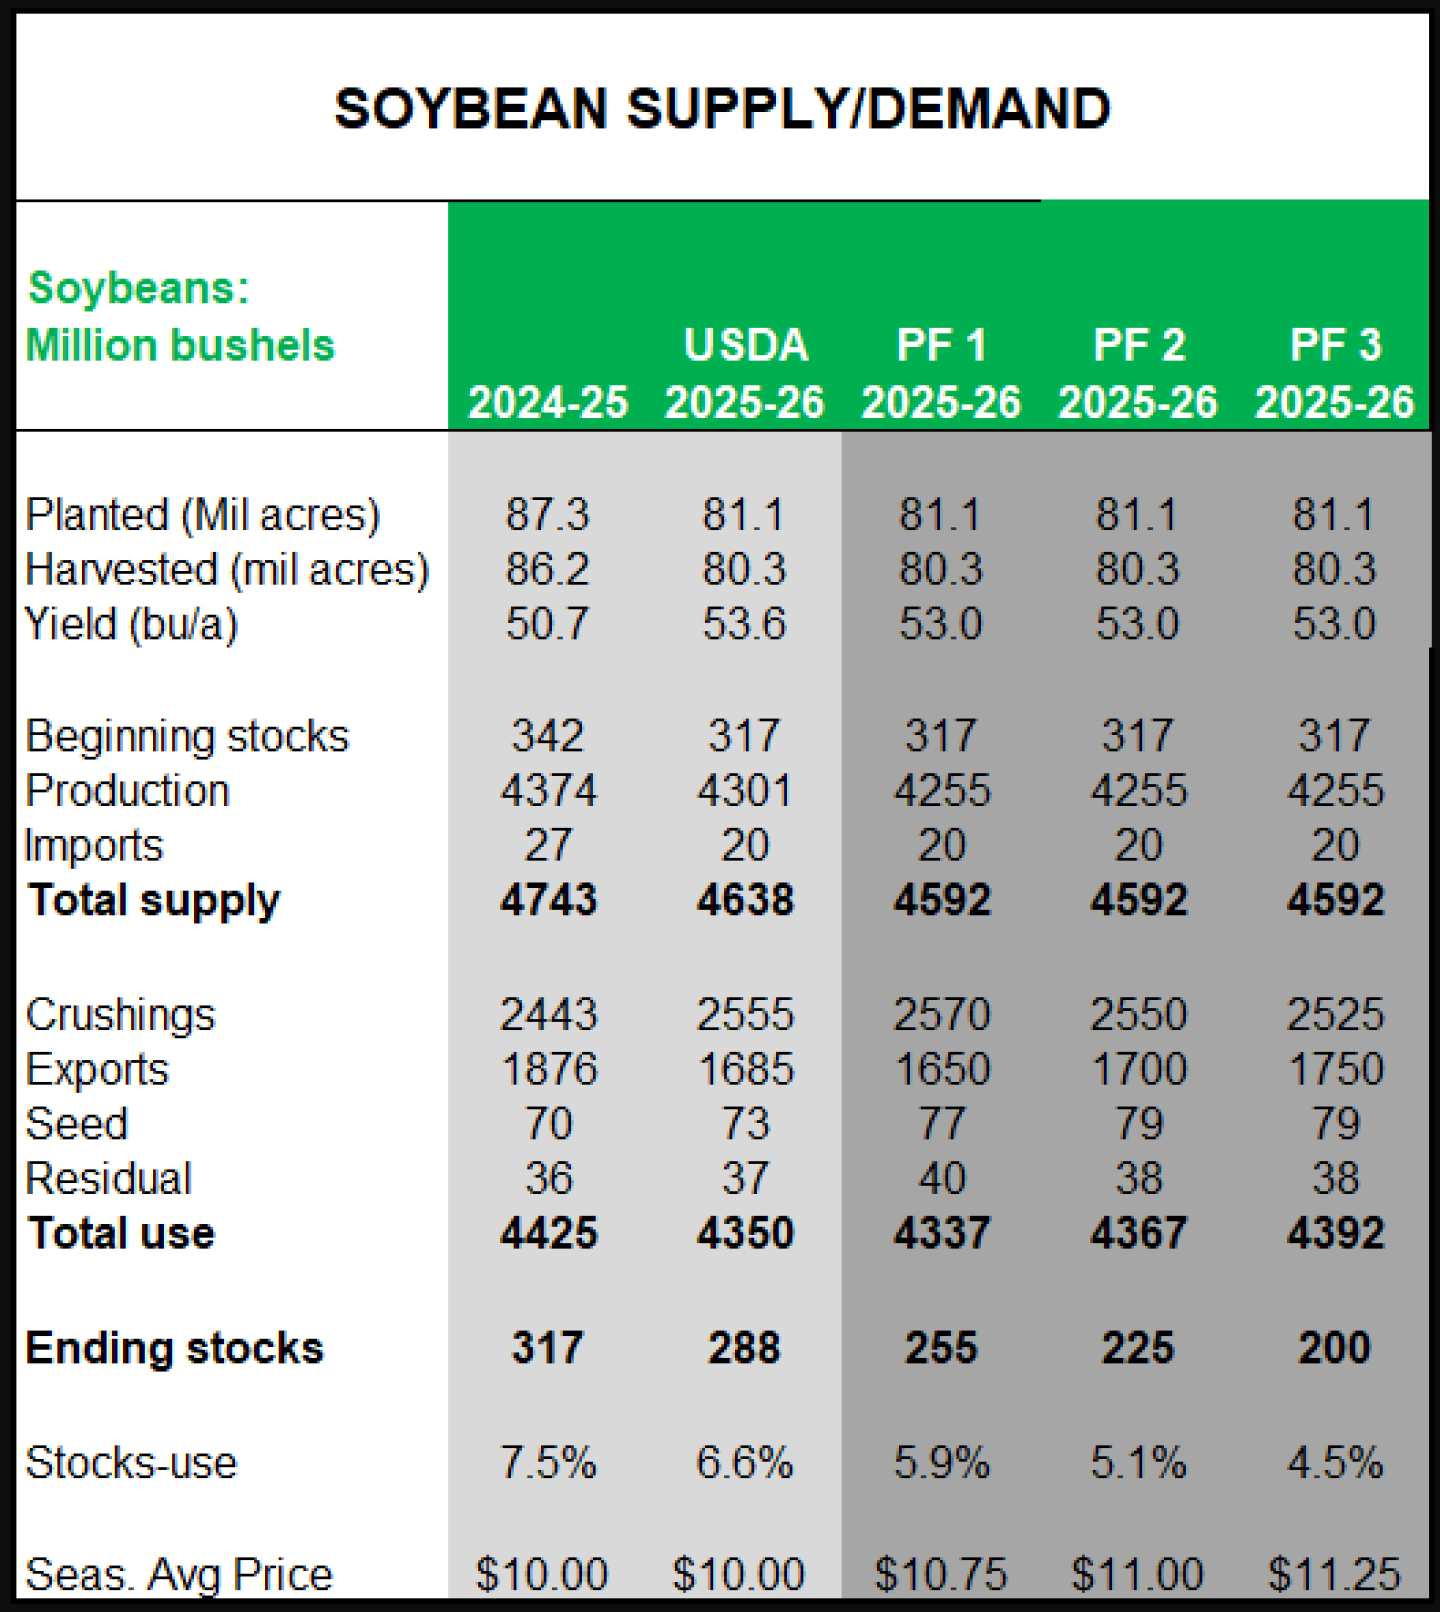
That begs the question, what could U.S. exports look like with China potentially re-entering the U.S. market? The tight 81 million acres of soybeans leaves little room for big demand shifts. We continue to anticipate production totaling 4,255 million bushels, down from USDA’s estimate of 4,301 million in their latest report. That brings total supplies to 4,592 million bushels, the tightest since 2023-24.
Crush use has expanded over the past several years with more plants expected to come online in the coming months. Combining that with persistent robust strength in soyoil demand, we anticipate crush to mark another record in 2025-26, which would be the fifth-consecutive year of record-breaking crush use.
If prices were to see a significant rally during the marketing year, one could expect crush use to modestly fall, but even when soy prices were in the teens in the early 2020’s, crush use broke records. EPA’s decision on refinery exemptions could also have an effect on crush use. Residual and seed use has totaled near 115 million bushels in the past five years, so that is a safe assumption for use in 2025-26.
Taking those use categories out of total supplies leaves 1,907 million bushels left over. It is unreasonable to believe that the U.S. would export all of the surplus, so eventually price would need to ration demand, especially if China returns to the U.S. market in a big way.
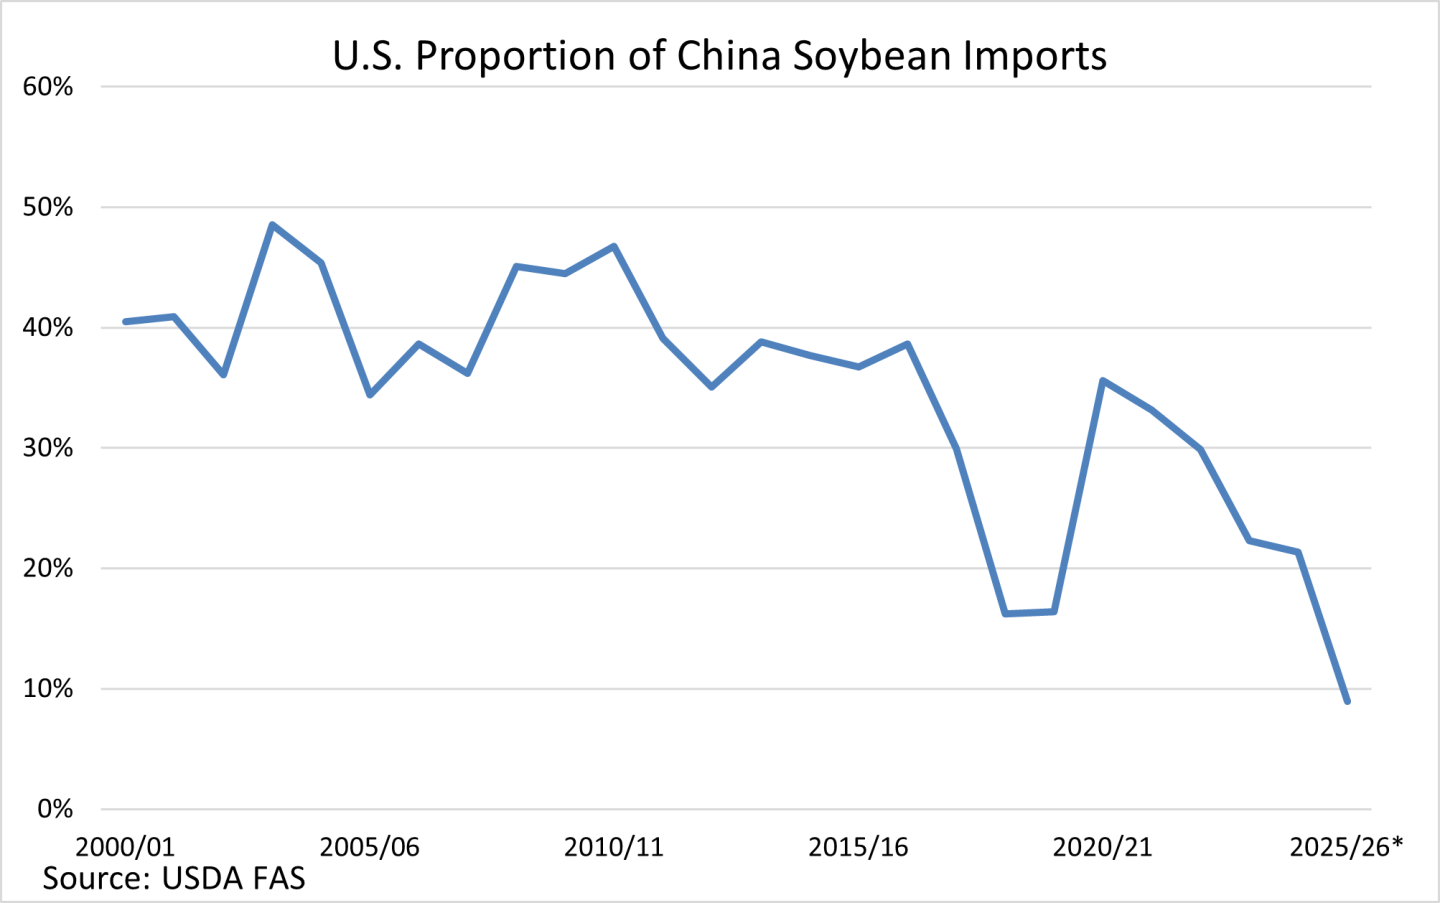
China has yet to book any shipments of soybeans for delivery during the December to January timeframe. It is estimated they have around 10 MMT to book, which would be around 367.5 million bushels. If China were to import 10 MMT, that would be around 9% of their total imports. That comes in below the lows seen in 2018-19 and 2019-20, each of which came in at 16%.
Following the Phase 1 purchase agreement signed in 2020, China imports have totaled around 21-22%. Prior to the trade war that began in Trump’s first term, China imported on average 39% of their soybeans from the U.S.
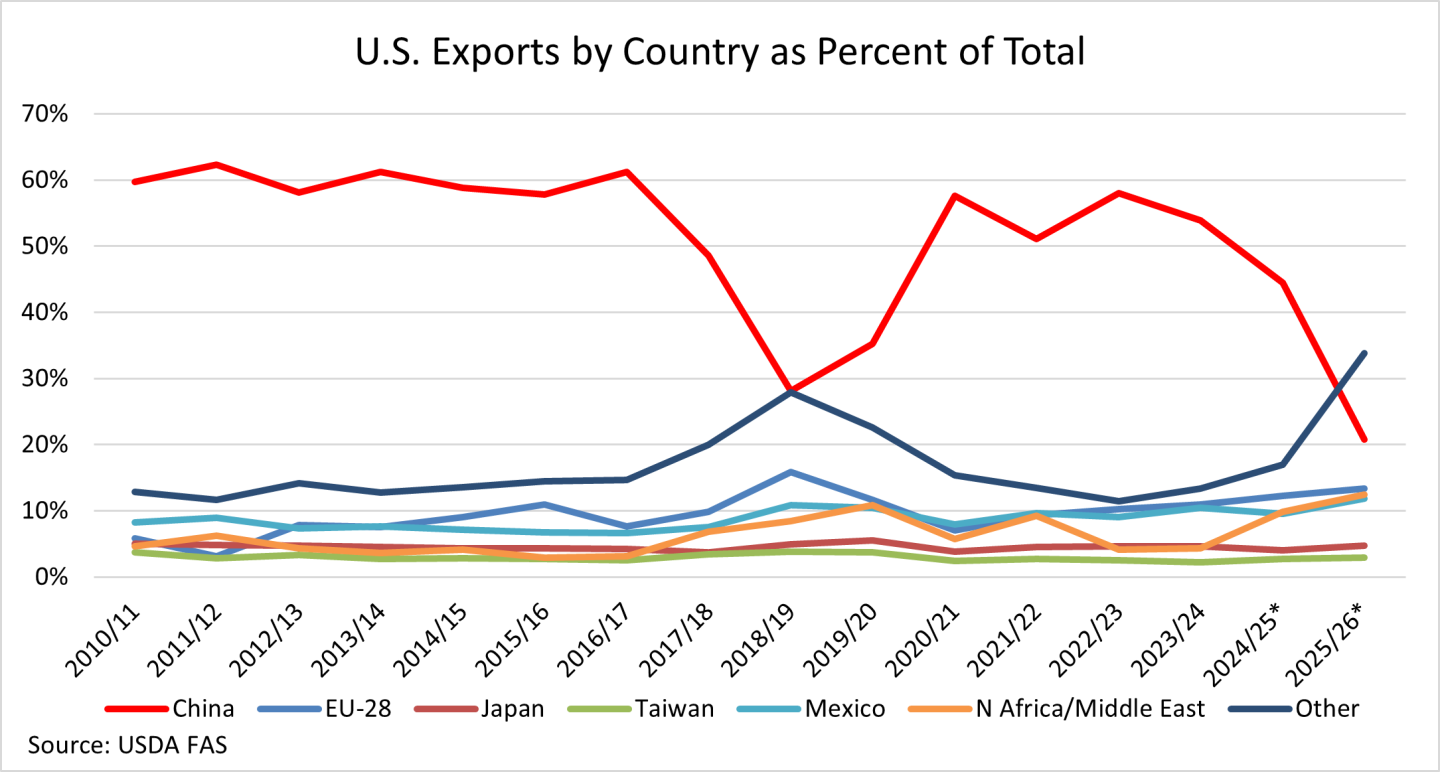
Since then, exports to China fell while exports to other countries increased. That tendency is expected to continue in the 2025-26 marketing year.
Even if China returns to the U.S. market for soybeans, purchases are not going to match the levels of the past couple years. The chart below uses the latest USDA export estimate of 1,685 million bushels and our forecast of where those bushels are going, assuming China purchases around 350 million bushels, which is somewhat conservative.
We have three scenarios to look at:
Scenario 1: Crush use rises to near full expected capacity. China has little involvement in the U.S. export market with the U.S. picking up the lion’s share of other countries’ imports.
Scenario 2: Crush use is somewhat tempered by tight stocks and higher soybean prices. China buys around 10 MMT of U.S. soybeans, higher prices spur higher 2026 soybean acres.
Scenario 3: China buys around 20 MMT, limiting U.S. crush use amid higher soybean prices. Exports to China equal a similar proportion of total exports as seen the past couple of years, changing world trade flows little.
The table above uses USDA’s demand assumptions from the September WASDE, the September Crop Production figures and incorporates 2024-25 ending stocks released in the Sept. 30 Grain Stocks Report, released a day before the ongoing government shutdown, for the 2025-26 USDA estimate.


