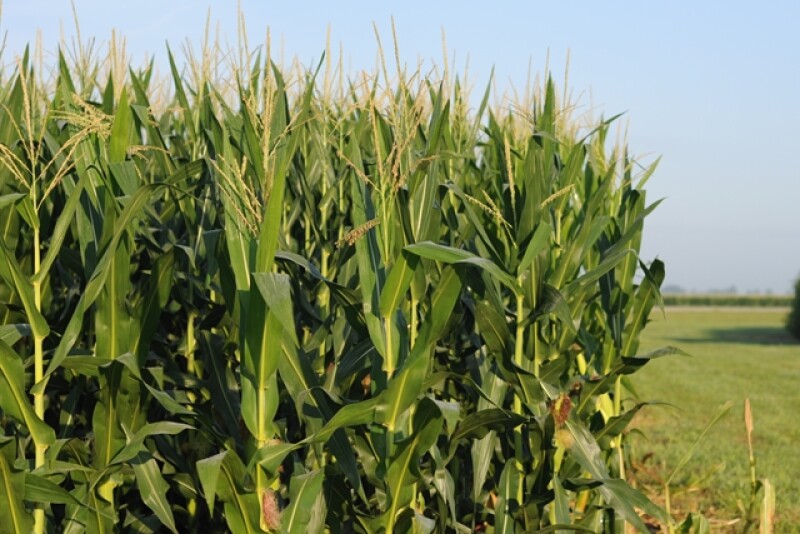
USDA rated the corn crop as 69% “good” to “excellent” and 9% “poor” to “very poor,” the soybean crop 65% “good” to “excellent” and 10% “poor” to “very poor”. USDA has stopped tracking spring wheat condition for the season now that the crop is more than 50% harvested.
On the weighted Pro Farmer Crop Condition Index (CCI; 0 to 500-point scale, with 500 representing perfect), the corn crop declined 4.4 points to 377.2. The soybean crop decreased 7 points. Extended periods of dryness across the lower Midwest and the areas surrounding the lower Mississippi river have caused crops in those areas to experience some stress and condition declines. Still, at the national level the corn crop remains well above last year’s condition, and soybeans are rated similarly as this time a year ago.
Pro Farmer Crop Condition Index for Corn | |||
| State | This Week | Last week | Year-ago |
| Colorado (0.86%*) | 3.14 | 3.02 | 2.53 |
| Illinois (15.63%) | 53.46 | 55.96 | 57.71 |
| Indiana (6.96%) | 24.92 | 25.06 | 25.90 |
| Iowa (17.37%) | 70.54 | 70.88 | 66.92 |
| Kansas (4.27%) | 15.28 | 15.24 | 13.97 |
| Kentucky (1.63%) | 5.52 | 5.73 | 6.36 |
| Michigan (2.32%) | 8.17 | 8.12 | 8.84 |
| Minnesota (9.85%) | 38.11 | 38.41 | 36.00 |
| Missouri (3.80%) | 14.82 | 14.89 | 14.21 |
| Nebraska (11.37%) | 45.14 | 45.60 | 42.59 |
| North Carolina (0.69%) | 2.72 | 2.73 | 1.57 |
| North Dakota (3.26%) | 11.87 | 11.51 | 10.50 |
| Ohio (4.18%) | 14.76 | 15.22 | 13.25 |
| Pennsylvania (0.66%) | 2.74 | 2.63 | 2.66 |
| South Dakota (5.47%) | 21.34 | 21.61 | 19.12 |
| Tennessee (0.81%) | 2.82 | 2.88 | 3.00 |
| Texas (1.41%) | 5.27 | 5.27 | 4.54 |
| Wisconsin (3.66%) | 14.76 | 14.72 | 13.82 |
| Corn total | 377.21 | 381.58 | 366.75 |
* denotes percentage of total national corn crop production.
Pro Farmer Crop Condition Index for Soybeans | |||
| State | This Week | Last week | Year-ago |
| Arkansas (3.82%*) | 14.20 | 14.13 | 14.21 |
| Illinois (15.74%) | 52.56 | 55.55 | 57.18 |
| Indiana (7.90%) | 28.19 | 28.42 | 28.92 |
| Iowa (13.73%) | 53.69 | 54.10 | 54.18 |
| Kansas (3.03%) | 11.19 | 11.16 | 11.64 |
| Kentucky (2.32%) | 7.40 | 8.03 | 8.39 |
| Louisiana (1.18%) | 4.67 | 4.74 | 4.56 |
| Michigan (2.38%) | 8.36 | 8.48 | 8.67 |
| Minnesota (8.19%) | 31.86 | 31.70 | 30.60 |
| Mississippi (2.38%) | 8.84 | 8.87 | 8.75 |
| Missouri (6.45%) | 23.88 | 24.52 | 23.79 |
| Nebraska (6.60%) | 25.75 | 26.41 | 25.94 |
| North Carolina (1.48%) | 5.43 | 5.68 | 5.04 |
| North Dakota (5.18%) | 18.49 | 18.33 | 16.43 |
| Ohio (6.31%) | 22.09 | 22.97 | 20.64 |
| South Dakota (5.06%) | 19.92 | 19.87 | 18.16 |
| Tennessee (1.82%) | 5.71 | 5.96 | 5.75 |
| Wisconsin (2.52%) | 10.22 | 10.17 | 9.51 |
| Soybean total | 366.73 | 373.65 | 366.70 |
* denotes percentage of total national soybean production.

