More volatility and at least one to two more years of challenged/negative margins. That is the summary of the harvest outlook from Rabo analysts.
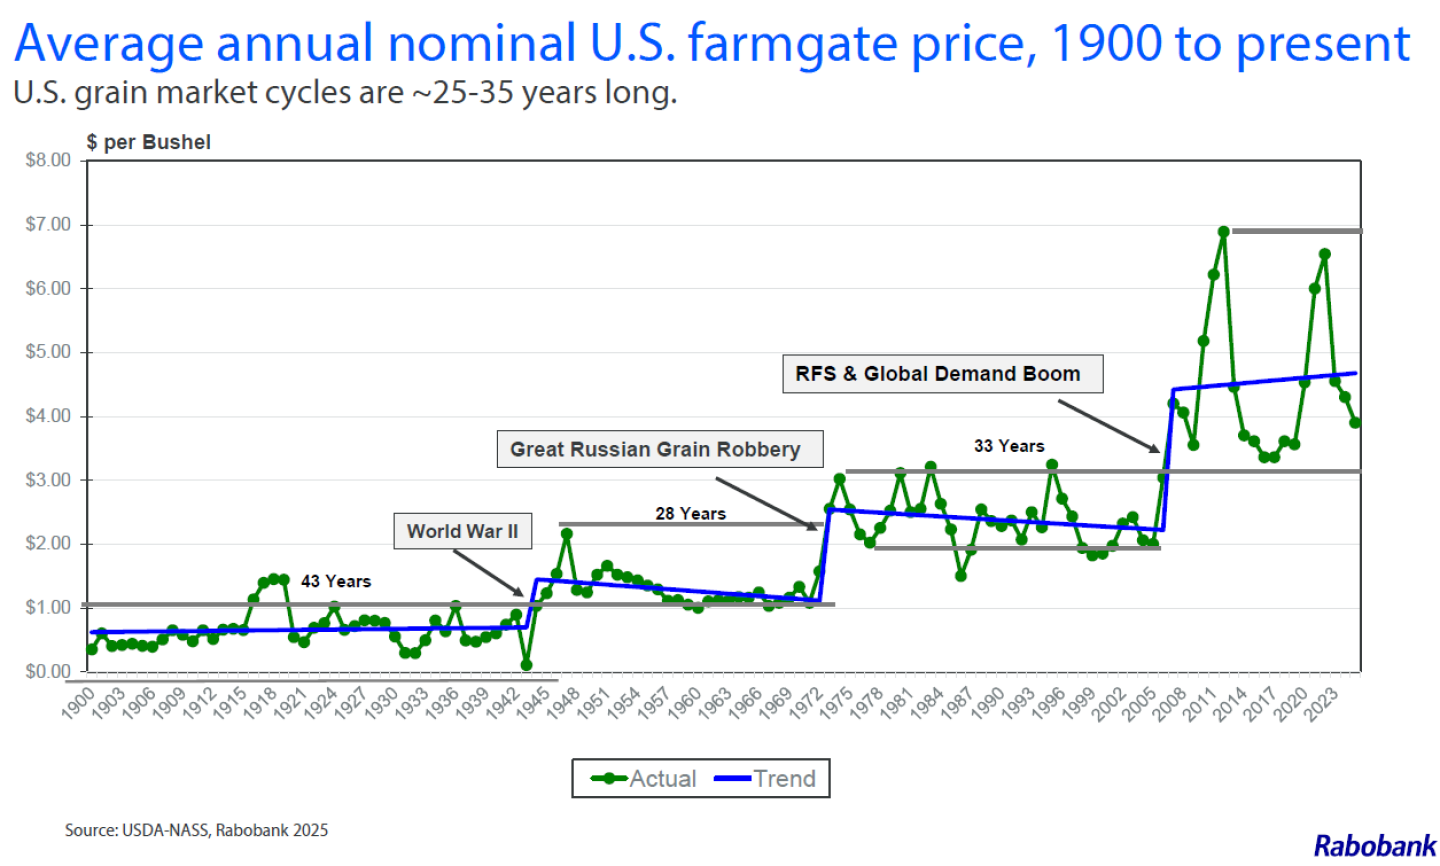
As Steve Nicholson, grains and oilseeds analyst, points out the average price cycle for row crop farmgate prices ranges from 25 to 35 years since 1900 to the present.
“When we think about that 25 to 35 year cycle, it helps us understand what’s happening and the movement of prices over time, and how we’ve moved each time to new plateaus,” he says. “So we are now in year 17 of the current cycle. And what’s important to note that is different than past cycles is the range was typically $1/bu to $1.50/bu in each cycle, now in our current cycle the price range is $4/bu. The range is bigger. There’s more volatility.”
Nicholson says fundamentally the volatility is driven by supply and demand shocks. for most crops.
“Take corn and wheat, for example, exporters are holding a smaller share of stocks in the world, and there’s a similar story for rice,” Nicholson says. “Soybeans are the exception, as the two big producers have big stocks being held by those exporters.”
As for stocks-to-use ratio, Nicholson says corn and wheat are at comfortable levels but in a multi-year decline, and as such when there’s any production shortfall, the potential price volatility increases and the market can move quickly.
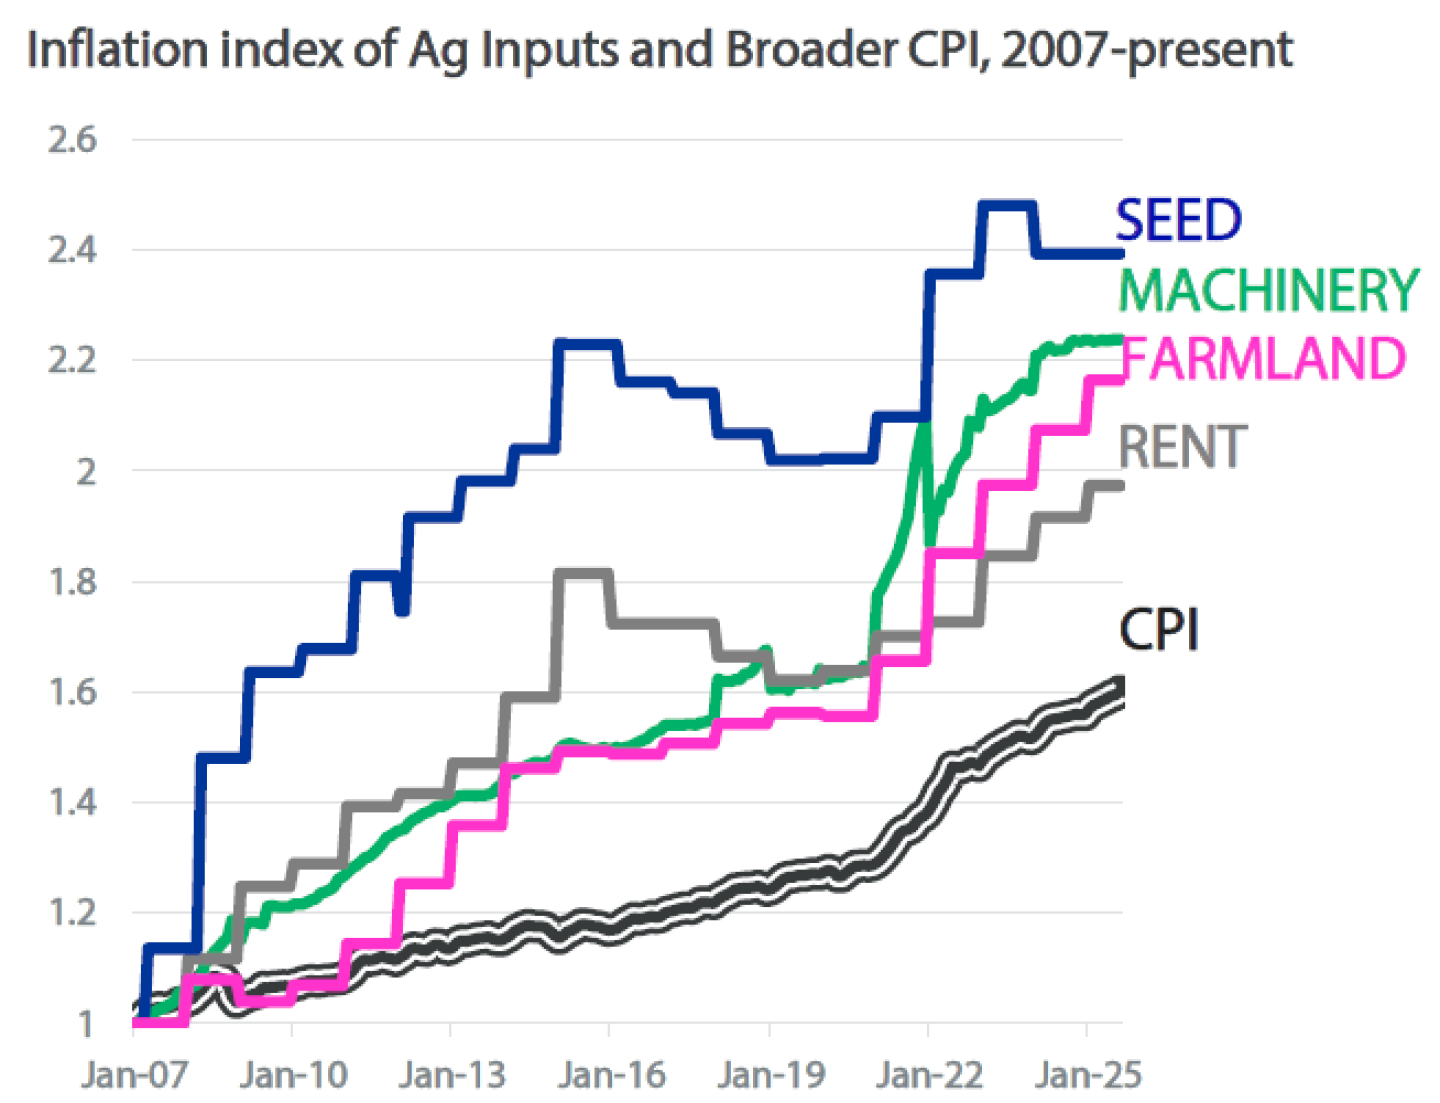
As for how this translates to farm gate economics, Nicholson and his colleagues say their modeling shows corn and soybeans production margins return to breakeven or positive in 2027/2028 marketing year. The main culprit dragging down margins is “stickier than usual input costs.”
“We’re still two crops from breakeven,” Nicholson says.
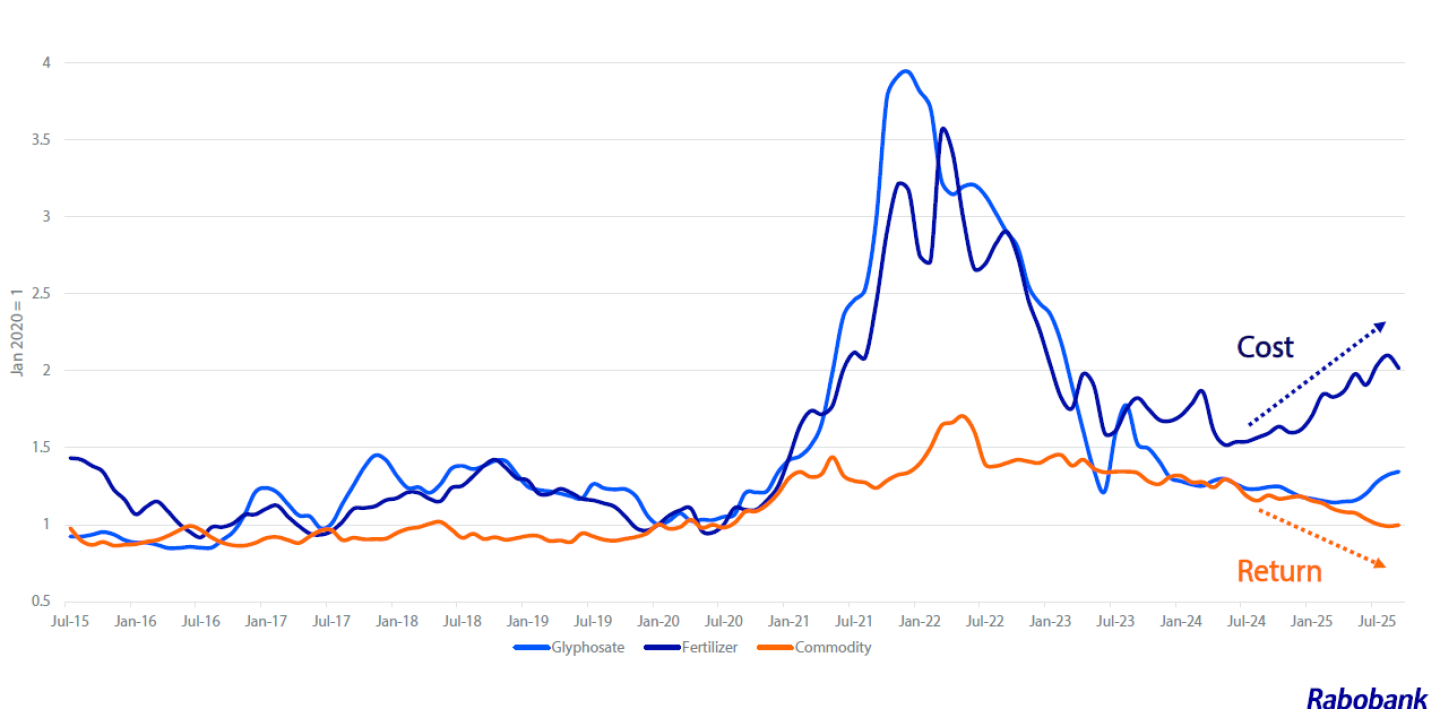
Sam Taylor, ag inputs analyst at Rabo says since this time last year there’s been a notable dislocation between costs and returns.
“Fertilizer has kept us awake for several years,” he says. “But through 2020 to 2023, the anomaly of high fertilizer was matched by commodity price run ups. That has dissipated into the current circumstances where since May of last year we’ve had a sequence of one after another of compounding geopolitical events: gas supplies out of northern Africa, Chinese limits on exports of urea and phosphates, issues in the Stait of Hormuz, and companies limiting exports and curtailing production.”
Taylor says the current affordability indexes for fertilizer should be resulting in demand destruction, but there’s no evidence of farmers cutting back on inputs.
“For example with phosphates, the affordability index since 2022 has gotten worse. It’s a terrible situation for US growers. It doesn’t fit into our traditional context of displaying it,” Taylor says. “It hasn’t been as bad as 2008, which had a different dynamic as we had credit issues and affordability issues. But then farmers cut back on phosphates by 25%, which created an ability to correct the market. Prices corrected back to the mean.”
Taylor says to see a similar price correction, demand would have to decrease by 20 to 25%.
“We are creating a moat in trade and tariffs. U.S. farmers are paying a 10% price premium on MAP as a result of countervailing duties,” he says. “We have become near enough self-supplying in MAP as long as we don’t export any we can make our ends meet. We have headwinds going into 2026. It’s not just government subsidies that have created confusion to the market, but the tariffs and taxes have impacted the cost of production for U.S. growers.”
Taylor says there’s a delay and distortion in the market signals caused by the government interventions, which supports his idea that prices will remain higher for longer. This includes not only phosphates but nitrogen as well.
Higher production costs are weighing on the farmer balance sheet.
“If we go two or three years back, folks were pulling 20% to 30% of their operating lines. And now that number is 50% pulling off that operating line,” Nicholson says. “They need the financing because they aren’t getting the returns. And we’ve already see them pull back—pretty dramatically—on equipment purchasing for example.”
Owen Wagner, ag policy analyst for Rabo, says in assessing the levers to pull agriculture out of this lack of profitability are indicating the current government supports for farmers are potentially delaying the correction.
“More of these government supports are insurance subsidies and ad-hoc payments, and as such risk management programs are melding into income supports,” Wagner says. “The supports out of Washington are necessary in the short term, but what are the long term impacts of the well intentioned policies?”
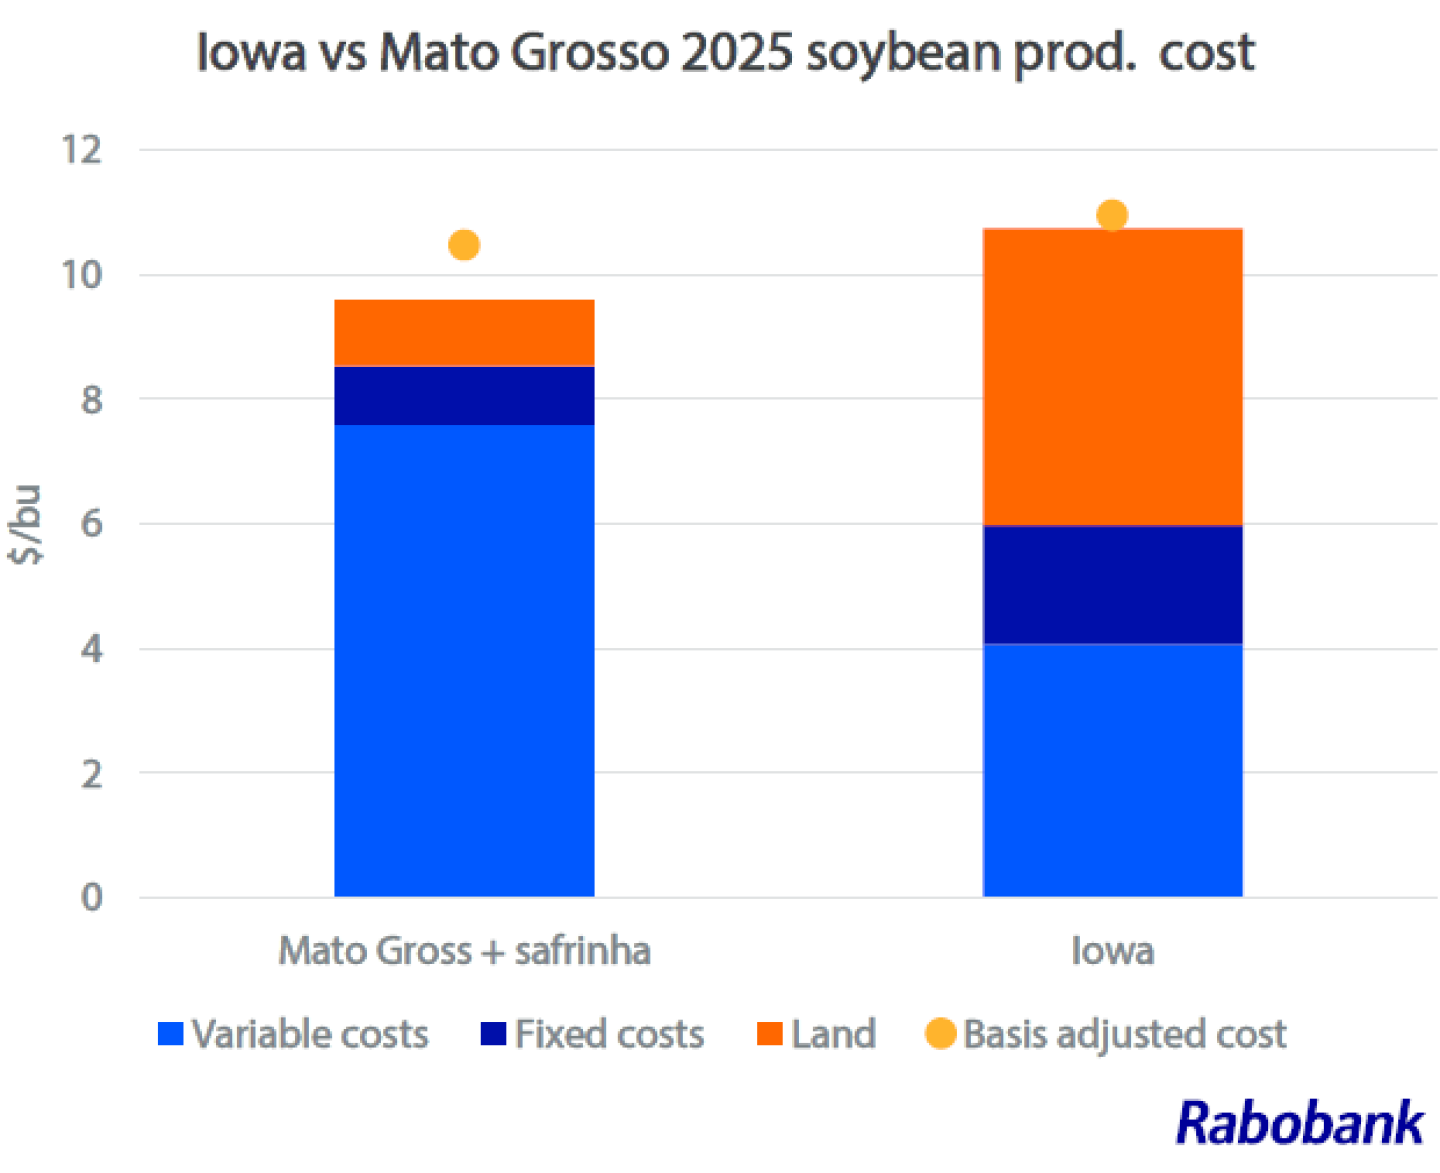
Comparing 2025 production costs for soybeans in Iowa vs. Mato Grosso, Brazil, Wagner says it would take a 10% decline in land rental rates for Iowa’s production costs to be competitive.
As for 2026 production, Nicholson says the current models point to 2 to 3 million less acres of corn, with soybean acres changing day-to-day.


