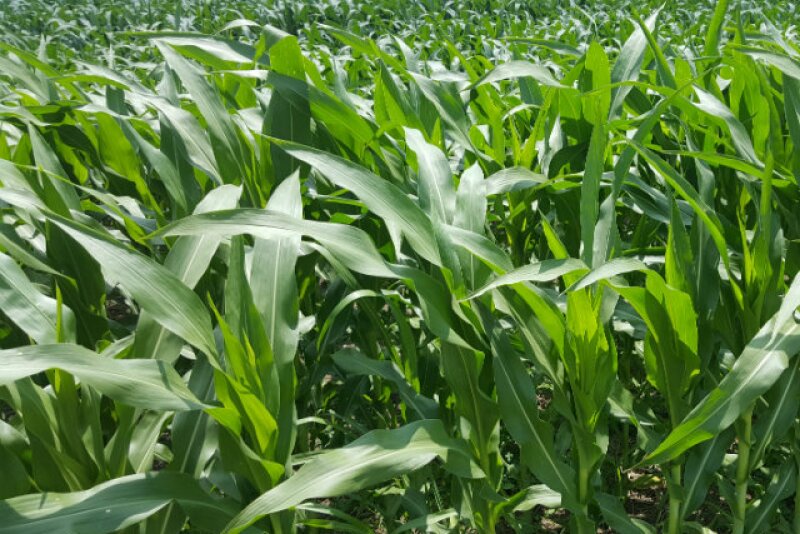
USDA rated the corn crop as 70% “good” to “excellent” and 6% “poor” to “very poor,” the soybean crop 66% “good” to “excellent,” and 7% “poor” to “very poor” and the spring wheat crop 54% “good” to “excellent” and 15% “poor” to “very poor.”
On the weighted Pro Farmer Crop Condition Index (CCI; 0 to 500-point scale, with 500 representing perfect), the corn crop declined 1.0 points to 377.9, the soybean crop dropped 1.2 points to 362.7 and the spring wheat crop fell 6.0 points to 354.3. The corn crop is now rated 3.6 points above last year. The soybean crop is 0.3 point below year-ago and spring wheat is 19.4 points below last year.
| Pro Farmer Crop Condition Index for Corn | |||
| This Week | Last week | Year-ago | |
| Colorado (0.86%*) | 3.08 | 3.34 | 3.07 |
| Illinois (15.63%) | 59.40 | 58.62 | 55.10 |
| Indiana (6.96%) | 24.99 | 25.47 | 25.27 |
| Iowa (17.37%) | 69.49 | 70.01 | 66.06 |
| Kansas (4.27%) | 15.79 | 15.88 | 15.67 |
| Kentucky (1.63%) | 6.04 | 6.15 | 6.24 |
| Michigan (2.32%) | 8.14 | 7.98 | 8.79 |
| Minnesota (9.85%) | 38.11 | 37.72 | 36.59 |
| Missouri (3.80%) | 14.32 | 14.36 | 13.95 |
| Nebraska (11.37%) | 42.76 | 43.55 | 46.71 |
| North Carolina (0.69%) | 2.82 | 2.70 | 2.22 |
| North Dakota (3.26%) | 11.41 | 11.84 | 10.55 |
| Ohio (4.18%) | 15.27 | 14.97 | 15.86 |
| Pennsylvania (0.66%) | 2.59 | 2.67 | 3.10 |
| South Dakota (5.47%) | 19.81 | 19.70 | 19.07 |
| Tennessee (0.81%) | 3.01 | 3.01 | 3.49 |
| Texas (1.41%) | 4.89 | 5.11 | 5.06 |
| Wisconsin (3.66%) | 14.10 | 13.84 | 13.75 |
| Corn total | 377.90 | 378.88 | 374.33 |
* denotes percentage of total national corn crop production.
| Pro Farmer Crop Condition Index for Soybeans | |||
| This Week | Last week | Year-ago | |
| Arkansas (3.82%*) | 14.13 | 13.59 | 14.14 |
| Illinois (15.74%) | 56.81 | 56.81 | 55.14 |
| Indiana (7.90%) | 28.34 | 28.74 | 27.89 |
| Iowa (13.73%) | 53.28 | 54.10 | 52.76 |
| Kansas (3.03%) | 11.09 | 10.91 | 12.50 |
| Kentucky (2.32%) | 8.52 | 8.86 | 8.36 |
| Louisiana (1.18%) | 4.52 | 4.32 | 4.68 |
| Michigan (2.38%) | 8.01 | 8.17 | 8.69 |
| Minnesota (8.19%) | 31.37 | 30.96 | 30.67 |
| Mississippi (2.38%) | 9.79 | 9.39 | 9.04 |
| Missouri (6.45%) | 23.81 | 24.01 | 23.79 |
| Nebraska (6.60%) | 24.16 | 24.76 | 27.67 |
| North Carolina (1.48%) | 5.62 | 5.67 | 4.49 |
| North Dakota (5.18%) | 17.97 | 18.59 | 16.80 |
| Ohio (6.31%) | 22.47 | 22.15 | 23.42 |
| South Dakota (5.06%) | 18.05 | 18.10 | 18.11 |
| Tennessee (1.82%) | 1.00 | 1.00 | 1.00 |
| Wisconsin (2.52%) | 9.61 | 9.61 | 9.61 |
| Soybean total | 362.70 | 363.94 | 362.98 |
* denotes percentage of total national soybean production.
| Pro Farmer Crop Condition Index for HRS Wheat | |||
| This Week | Last week | Year-ago | |
| Idaho* (6.57%) | 23.17 | 23.31 | 27.60 |
| Minnesota (15.24%) | 59.59 | 59.74 | 55.41 |
| Montana (13.14%) | 33.91 | 37.85 | 58.50 |
| North Dakota (54.94%) | 202.17 | 202.72 | 191.02 |
| South Dakota (6.10%) | 21.53 | 22.51 | 23.49 |
| Washington (4.01%) | 13.93 | 14.17 | 17.66 |
| HRS total | 354.30 | 360.30 | 373.67 |
* denotes percentage of total national HRS crop production.

