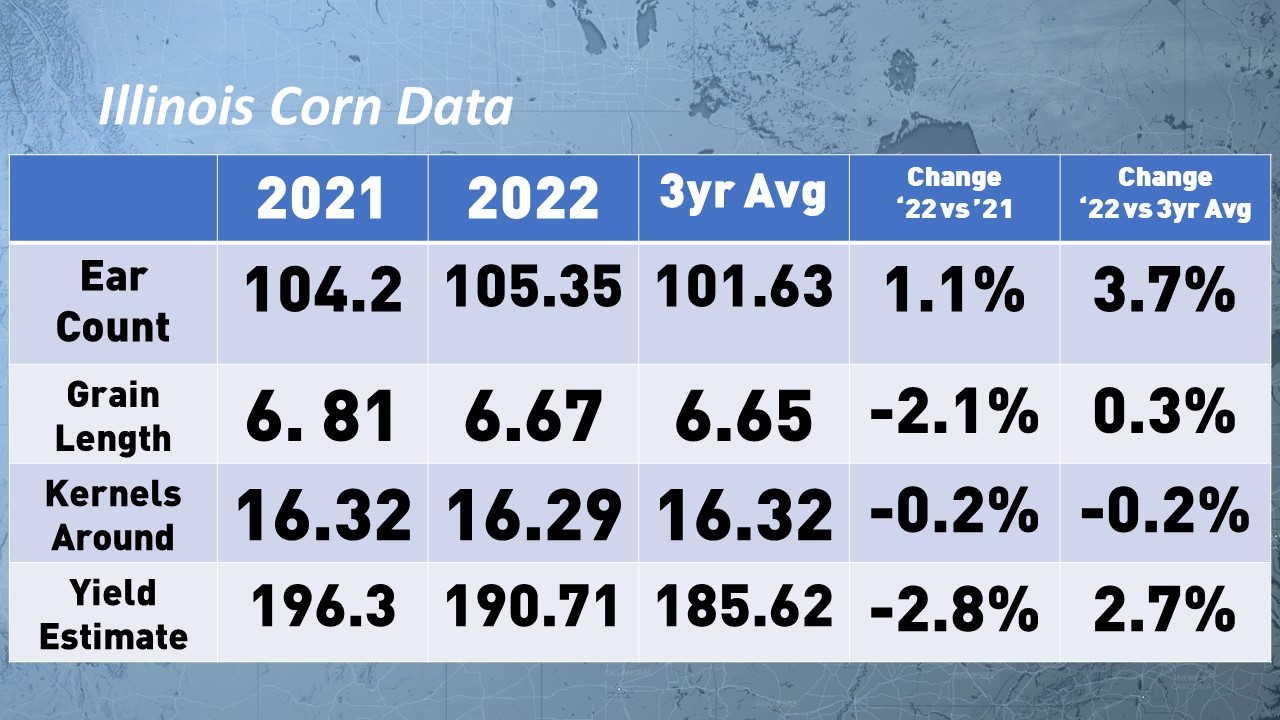
2022 Crop Tour results: Illinois

2022 Pro Farmer Crop Tour:
|
||||||
|
District |
Ear Count in 60 ft of Row |
Grain Length |
Kernel Rows Around |
Row Spacing |
Yield |
Samples |
|
IL 1 |
107.33 |
6.89 |
16.29 |
30.00 |
200.21 |
49 |
|
IL 2 |
105.63 |
6.92 |
16.67 |
30.00 |
201.87 |
8 |
|
IL 3 |
100.72 |
6.80 |
16.55 |
30.06 |
188.73 |
36 |
|
IL 4 |
107.07 |
6.75 |
16.29 |
30.00 |
195.42 |
59 |
|
IL 5 |
104.27 |
6.42 |
16.13 |
29.67 |
181.32 |
60 |
|
IL 6 |
107.00 |
6.57 |
16.29 |
30.00 |
192.75 |
16 |
|
IL 7 |
105.59 |
6.27 |
16.12 |
30.00 |
177.19 |
17 |
|
IL Average |
105.35 |
6.67 |
16.29 |
29.93 |
190.71 |
245 |
2021 Illinois Corn Results |
||||||
|
District |
Ear Count in 60 ft of Row |
Grain Length |
Kernel Rows Around |
Row Spacing |
Yield |
Samples |
|
IL 1 |
104.47 |
6.85 |
16.04 |
30.42 |
189.08 |
43 |
|
IL 2 |
100.33 |
7.32 |
16.33 |
30.00 |
199.25 |
12 |
|
IL 3 |
101.15 |
6.63 |
16.57 |
29.63 |
187.91 |
27 |
|
IL 4 |
109.24 |
6.72 |
16.65 |
29.84 |
205.49 |
62 |
|
IL 5 |
103.94 |
6.78 |
16.32 |
29.27 |
196.30 |
62 |
|
IL 6 |
92.06 |
6.61 |
15.49 |
29.41 |
181.95 |
17 |
|
IL 7 |
105.94 |
7.30 |
16.26 |
30.38 |
207.20 |
16 |
|
IL Average |
104.20 |
6.81 |
16.32 |
29.79 |
196.30 |
239 |
Three-year Average for Illinois Corn (2019-2021) |
||||||
|
District |
Ear Count in 60 ft of Row |
Grain Length |
Kernel Rows Around |
Row Spacing |
Yield |
Samples |
|
IL 1 |
100.59 |
6.69 |
16.14 |
30.19 |
180.72 |
41 |
|
IL 2 |
102.88 |
7.10 |
16.09 |
30.00 |
195.26 |
11 |
|
IL 3 |
101.37 |
6.50 |
16.68 |
29.82 |
184.54 |
26 |
|
IL 4 |
104.10 |
6.64 |
16.45 |
29.83 |
190.74 |
56 |
|
IL 5 |
100.41 |
6.56 |
16.20 |
29.50 |
180.69 |
56 |
|
IL 6 |
97.17 |
6.73 |
16.15 |
29.80 |
185.15 |
15 |
|
IL 7 |
104.46 |
6.77 |
16.55 |
30.13 |
195.10 |
14 |
|
IL Average |
101.63 |
6.65 |
16.32 |
29.84 |
185.62 |
217 |
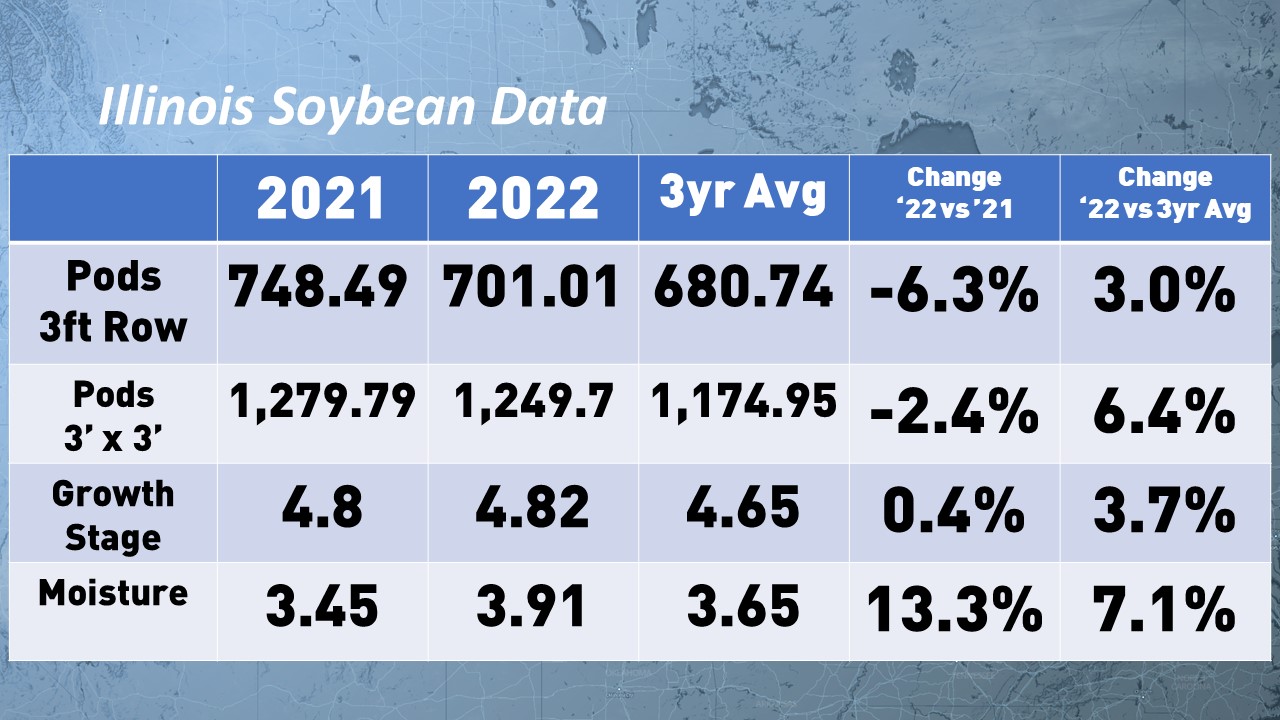
2022 Pro Farmer Crop Tour Data:
|
||||||
|
District |
Pod Count in 3’ |
Soil Moisture |
Growth Stage |
Row Spacing |
Pod Count in 3’X3’ Square |
Samples |
|
IL 1 |
833.98 |
4.53 |
4.86 |
22.24 |
1392.64 |
49 |
|
IL 2 |
895.33 |
5.00 |
4.88 |
22.50 |
1607.51 |
8 |
|
IL 3 |
683.63 |
3.03 |
4.91 |
20.14 |
1257.66 |
35 |
|
IL 4 |
729.20 |
4.00 |
4.79 |
22.59 |
1196.19 |
58 |
|
IL 5 |
569.56 |
4.00 |
4.73 |
18.47 |
1160.81 |
60 |
|
IL 6 |
707.88 |
3.63 |
4.88 |
20.00 |
1313.17 |
16 |
|
IL 7 |
623.38 |
3.06 |
4.82 |
21.03 |
1089.56 |
17 |
|
IL Average |
701.01 |
3.91 |
4.82 |
20.87 |
1249.70 |
243 |
2021 Illinois Soybeans Results |
||||||
|
District |
Pod Count in 3’ |
Soil Moisture |
Growth Stage |
Row Spacing |
Pod Count in 3’X3’ Square |
Samples |
|
IL 1 |
789.90 |
3.17 |
4.86 |
22.60 |
1292.91 |
42 |
|
IL 2 |
807.16 |
4.00 |
5.00 |
25.00 |
1172.21 |
12 |
|
IL 3 |
724.40 |
3.19 |
4.70 |
21.48 |
1211.25 |
27 |
|
IL 4 |
802.19 |
3.59 |
4.73 |
23.76 |
1255.58 |
63 |
|
IL 5 |
685.86 |
3.58 |
4.82 |
19.15 |
1337.84 |
62 |
|
IL 6 |
740.37 |
3.29 |
5.00 |
21.18 |
1277.25 |
17 |
|
IL 7 |
676.38 |
3.31 |
4.69 |
19.09 |
1314.75 |
16 |
|
IL Average |
748.49 |
3.45 |
4.80 |
21.67 |
1279.79 |
239 |
Three-year Average for Illinois Soybeans (2019-2021) |
||||||
|
District |
Pod Count in 3 feet |
Soil Moisture |
Growth Stage |
Row Spacing |
Pod Count in 3’X3’ Square |
Samples |
|
IL 1 |
702.85 |
3.55 |
4.67 |
22.15 |
1179.40 |
40 |
|
IL 2 |
697.67 |
3.97 |
4.56 |
23.75 |
1081.29 |
11 |
|
IL 3 |
685.13 |
3.35 |
4.70 |
21.17 |
1190.36 |
25 |
|
IL 4 |
722.28 |
3.80 |
4.64 |
23.18 |
1144.90 |
56 |
|
IL 5 |
607.32 |
3.67 |
4.60 |
18.95 |
1172.71 |
56 |
|
IL 6 |
728.94 |
3.60 |
4.87 |
21.77 |
1215.01 |
15 |
|
IL 7 |
672.49 |
3.68 |
4.58 |
19.28 |
1288.39 |
14 |
|
IL Average |
680.74 |
3.65 |
4.65 |
21.34 |
1174.95 |
216 |