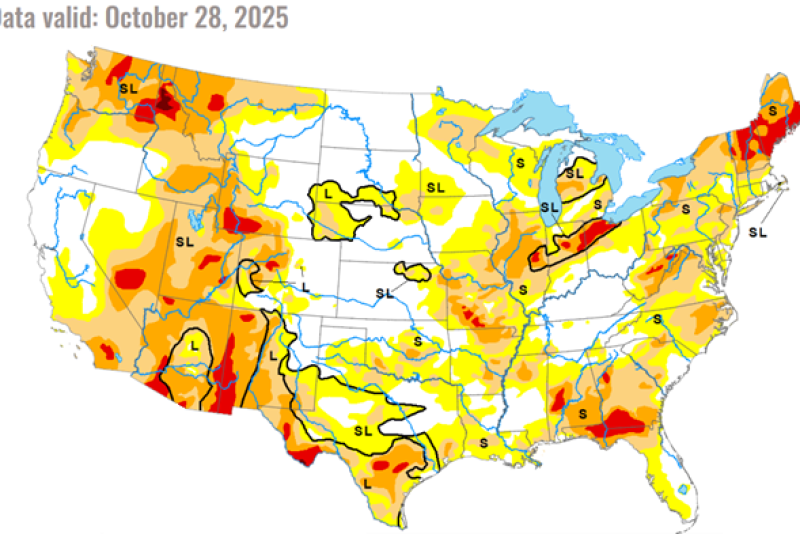
The October 28th drought monitor shows 69% of the U.S. is experiencing abnormal dryness or drought, down 3% from the previous week, with 43.6% in D1 level drought or higher, down 2.5%.
Improvement in drought condition was noted in some portions of the Pacific Northwest, the lower Plains, and across much of the area ranging from eastern Tennessee down to central Texas. In general these areas received rainfall that was significantly higher than normal for the fall season. Dry conditions look to return to most of the heavier crop producing regions next week, although wet conditions are expected to continue in the Northwest and spotty rains are called for in the Northeast corridor.
Currently 30% of corn acres are in D1-D4 drought (down 2%), with 34% of soybean acres (down 5%), and 40% of winter wheat acres (down 3%) also impacted. For livestock, 26% of the U.S.cattle herd is in D1-D4 drought conditions (down 1%), with 35% of dairy cattle also in drought (unchanged).
Click here to view related maps.
Drought in Select Row Crop States (%) | ||||||
| State | None | D0 | D1 | D2 | D3 | D4 |
| Arkansas | 17.72 | 40.42 | 27.47 | 14.39 | 0 | 0 |
| Colorado | 50.64 | 20.15 | 15.71 | 12.19 | 1.3 | 0 |
| Iowa | 33.76 | 54.33 | 11.91 | 0 | 0 | 0 |
| Illinois | 3.12 | 18.3 | 36.13 | 40.86 | 1.59 | 0 |
| Indiana | 29.31 | 29.81 | 24.38 | 10.54 | 5.96 | 0 |
| Kansas | 74.87 | 16.8 | 7 | 1.33 | 0 | 0 |
| Kentucky | 95.04 | 4.96 | 0 | 0 | 0 | 0 |
| Michigan | 41.47 | 30.14 | 22.36 | 6.03 | 0 | 0 |
| Minnesota | 34.02 | 43.67 | 22.32 | 0 | 0 | 0 |
| Montana | 30.68 | 15.01 | 29.04 | 23.24 | 2.03 | 0 |
| North Dakota | 97.15 | 2.85 | 0 | 0 | 0 | 0 |
| Nebraska | 65.22 | 22.48 | 12.3 | 0 | 0 | 0 |
| Ohio | 35.34 | 36.75 | 9.98 | 6.77 | 11.15 | 0 |
| South Dakota | 61.24 | 32.32 | 6.44 | 0 | 0 | 0 |
| Tennessee | 69.96 | 25.74 | 3.78 | 0.52 | 0 | 0 |
| Texas | 23.16 | 43.53 | 19.23 | 10.49 | 3.45 | 0.15 |
| Wisconsin | 29.57 | 57.82 | 12.16 | 0.46 | 0 | 0 |

