“The only constant is change” — an adage in both life and agricultural markets. While the Greek philosopher Heraclitus may not have been referring to WASDE forecasts, he may as well have been. USDA updated their new crop balance sheets in last week’s WASDE, giving the first real look into their assumptions for the 2025-26 marketing year.
Historically the May WASDE has been too optimistic on corn yields.
USDA began issuing yield estimates in May starting in 1993. Since then, there have been 16 years where the final yield exceeds the May forecast (avg of 4.7 bushels). Final totaled less than the May forecast the remaining 16 years for an avg of 8.8 bushels. Take out two worst years (1993 and 2012) that average comes down to 5.5 bushels. Avg all years is 2.1 bushels below the May estimate. The June yield has only ever came in below the May forecast.
This year, the high corn acreage indicated by our survey and USDA’s Prospective Plantings report will likely weigh on yield. Historically when acres are above average, yield will suffer.
Production chart shows a similar bias. Final production has exceeded May estimate 16 times since 1990 for an average of 479 million bushels. Final production below May estimate 19 years for an average of 879 million bushels. The chart shows throughout growing season, the risk is to the downside.
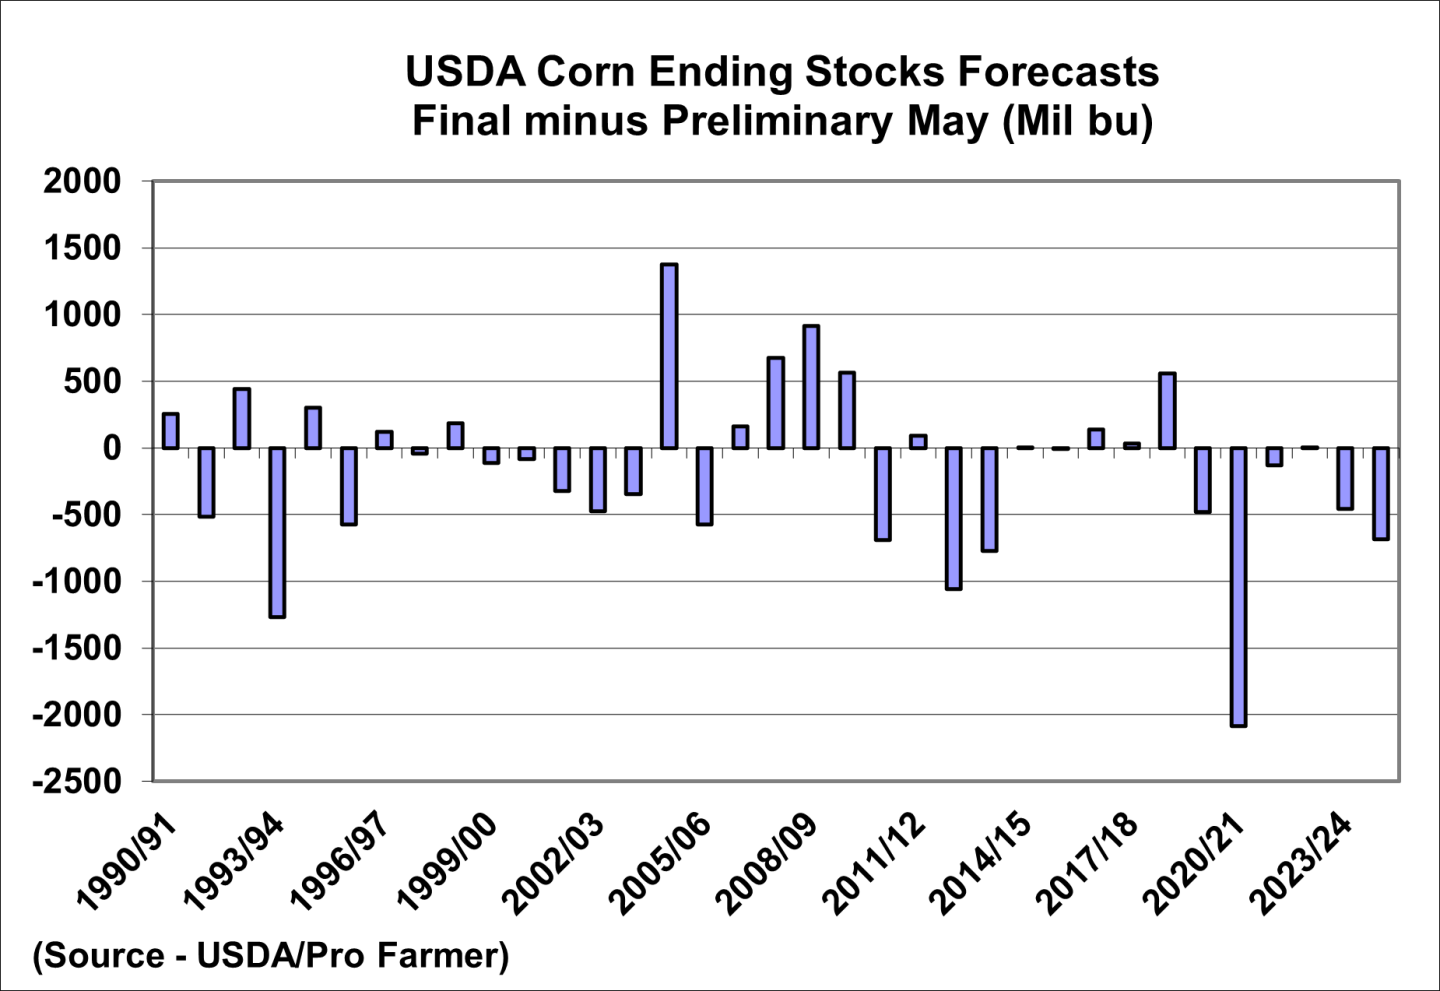
As one might expect, when production comes in lower, ending stocks tend to be tighter; production higher, stocks higher. Final stocks have been below the May forecast 19 times since 1990 (average 562 mil bu) and higher 16 times (average 363 mil bu).
Soybeans differ slightly more than corn and the results are more statistically significant over the course of the last 35 years.
While soybean yields have stalled in recent years, historically they outperform corn when compared to the May WASDE.
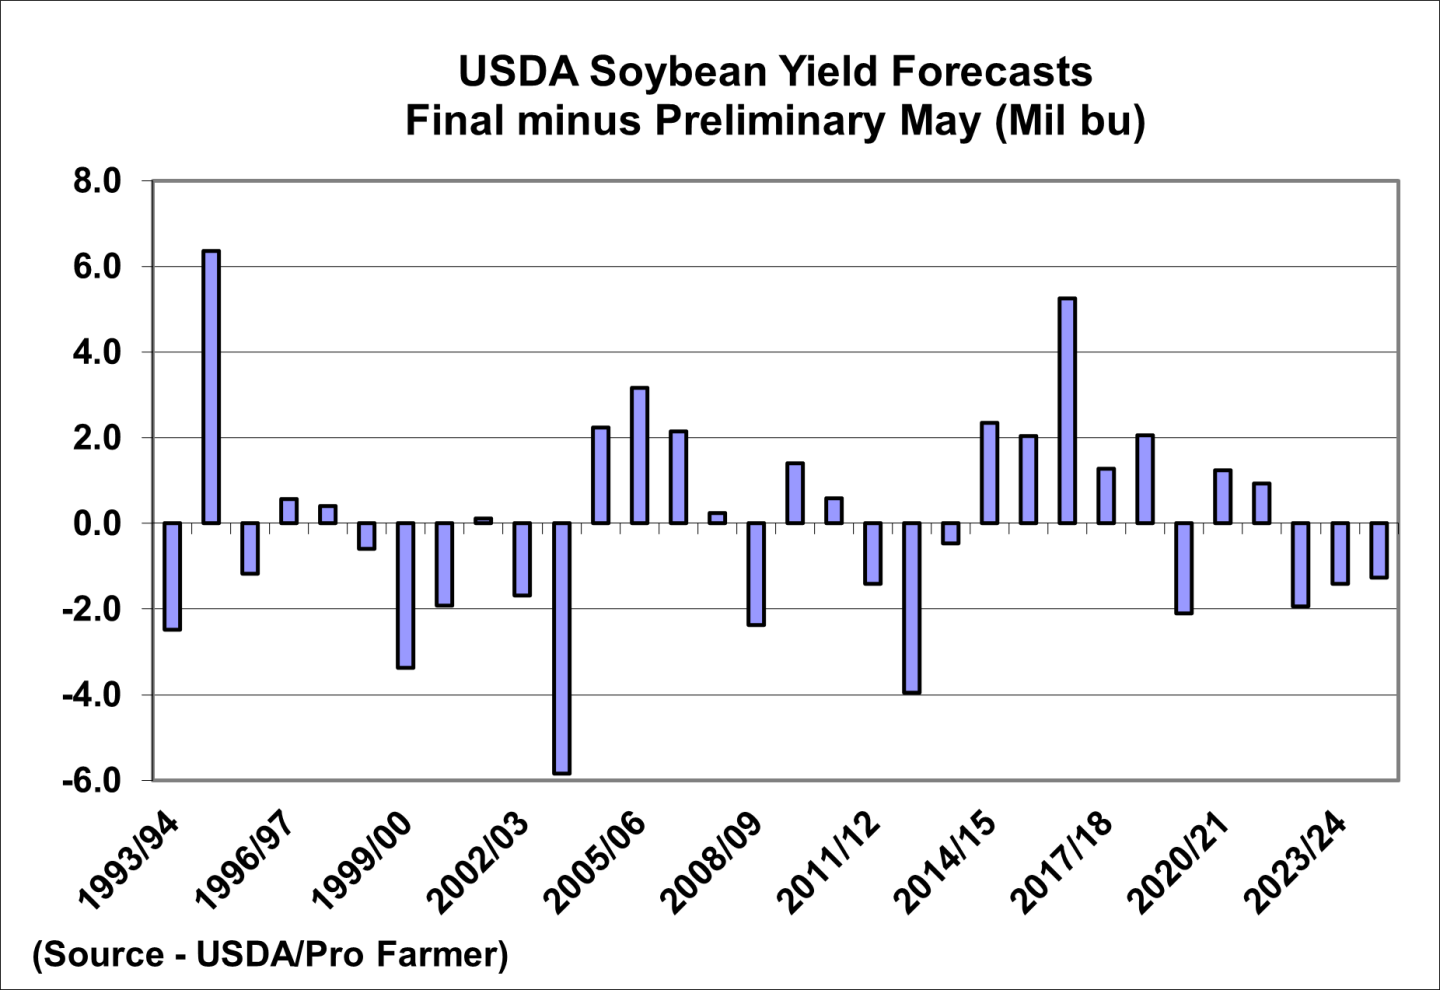
Only 15 years have final soy yields come below the May WASDE (avg 2.1 bu/ac). Remaining 17 years were higher (avg. 1.9 bu/ac). The average all years is essentially 0.
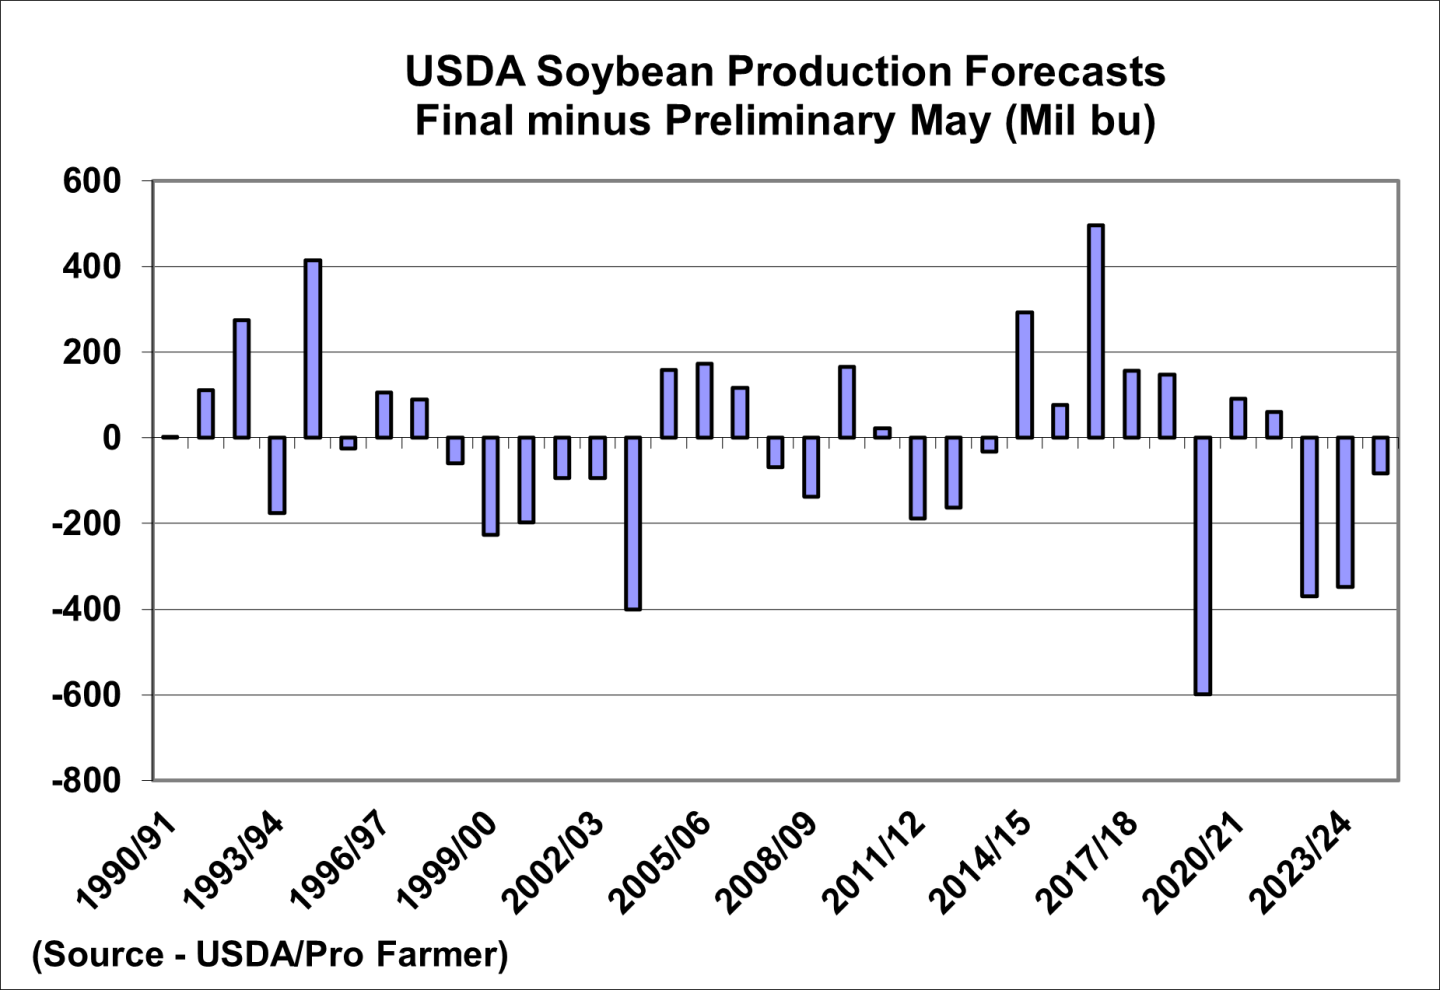
Final production tends to out perform the May WASDE. Since 1990, 18 years final production topped the May WASDE for an average of 164 million bushels. Remaining 17 years production was below May WASDE, average of 192 million bushels. This is similar to yield, but the additional three years at the beginning of the study period all outperformed, changing the results slightly. Worth noting production has been below benchmark three consecutive years.
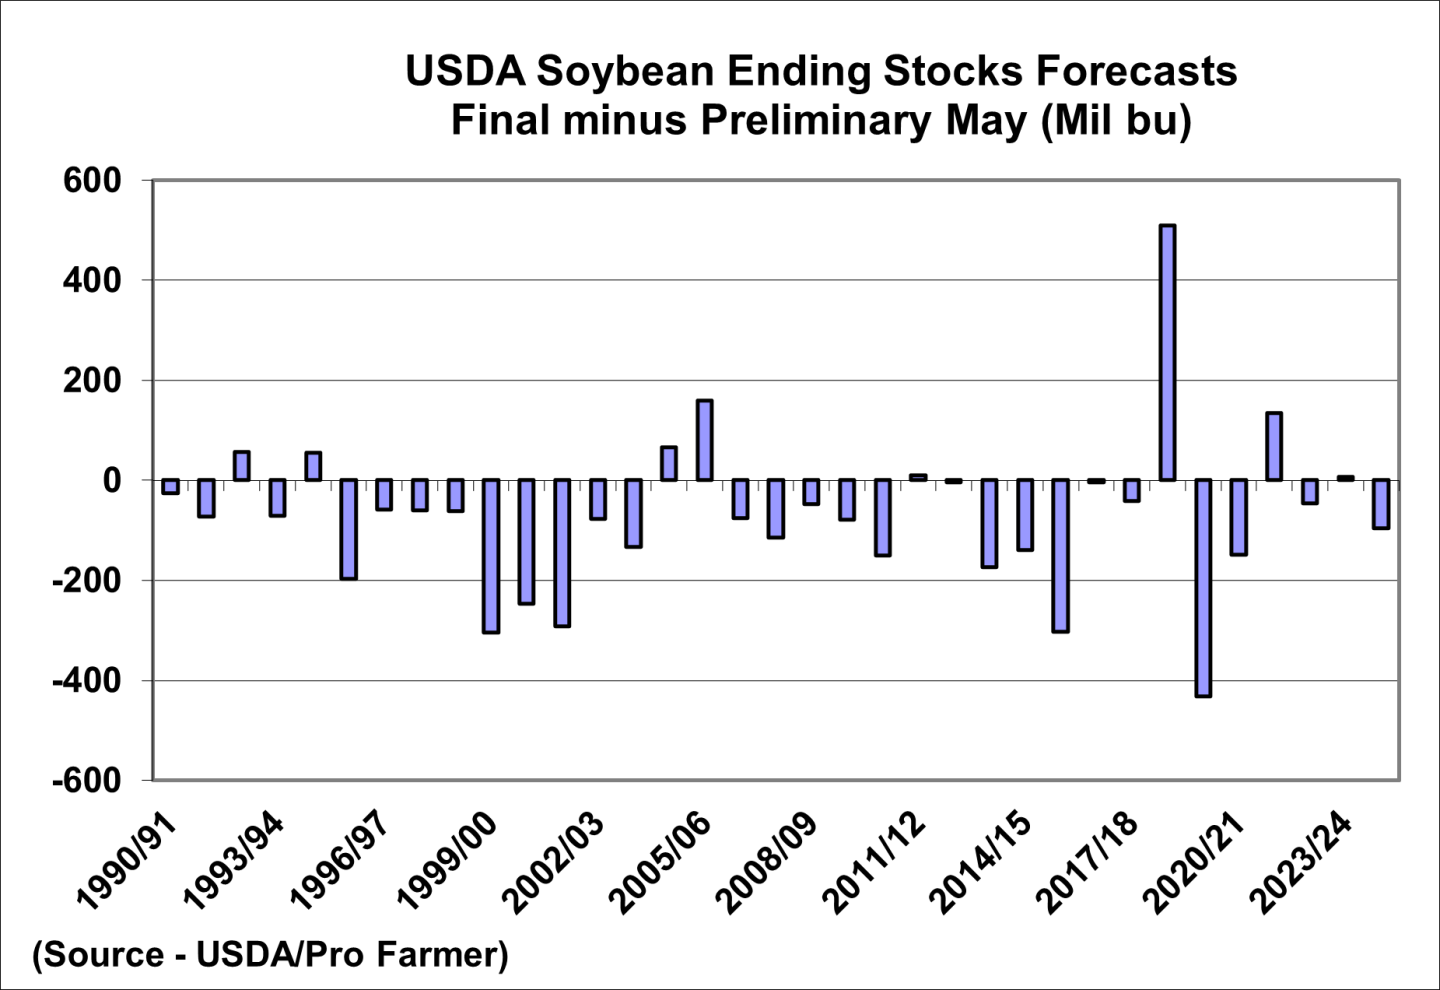
The above chart is rather eye opening. It is clear USDA often over estimates soybean ending stocks. Over the past 35 years, USDA has forecast ending stocks too high 27 times for an average of 128 million bushels. USDA too low 8 years for an average of 125 million bushels. Trade war in 2018/19 the obvious outlier.
Soybeans have the largest opportunity to outperform price wise over the coming year. Acres are anticipated to come in sharply lower and the favorable planting year could push acres even lower. Yield has been flat for the better part of a decade and with weather issues have become the norm rather than the exception, USDA’s estimate of 52.5 bushels/acre seems optimistic, which leaves the door open for both lower acres and yield.
Bottom line — tariffs remain at the forefront of concerns on the balance sheet. USDA was rather optimistic on both their corn and soybean export estimates. It ultimately comes down to whether or not deals get signed in the next couple of months before the new marketing year begins. While there is a tariff pause with China, that will run out before China typically begins buying the majority of their beans for the new-crop marketing year. On the other hand, if U.S. agricultural products get favorable deals, similar to the Phase 1 agreement with China earlier this decade, the opposite could be true, with exports performing remarkably well, but only time will tell on that front.


