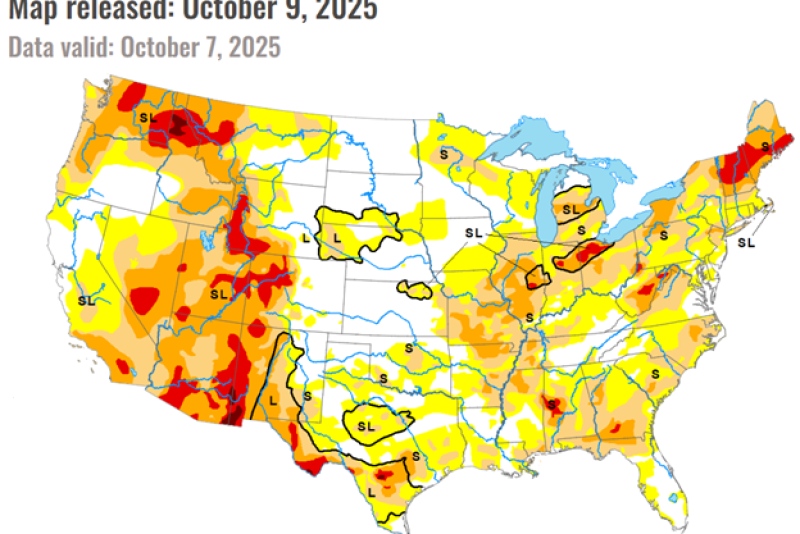
The October 7th drought monitor shows 73% of the U.S. is experiencing abnormal dryness or drought, up 3.2% from the previous week, with 45% in D1 level drought or higher, down 2.1%.
Notable changes from last week include widespread drought relief in the southern portions of the Ohio River Valley and the lower Mississippi. Dry conditions persisted in Texas and Oklahoma, with dryness in the eastern corn belt also continuing. These changes mostly led to increases in D0 for those states tending dryer, the earliest stages of drought conditions.
Currently 31% of corn acres are in D1-D4 drought (up 3% from last week), with 39% of soybean acres (up 2%), and 45% of winter wheat acres (unchanged) also impacted. For livestock, 25% of the U.S.cattle herd is in D1-D4 drought conditions (up 1%), with 39% (up 2%) of dairy cattle also in drought.
Click here to view related maps.
Drought in Select Row Crop States | ||||||
| State | None | D0-D4 | D1-D4 | D2-D4 | D3-D4 | D4 |
| Arkansas | 19.41 | 80.59 | 45.17 | 14.39 | 0 | 0 |
| Colorado | 45.82 | 54.18 | 44.99 | 34.74 | 14.34 | 0 |
| Iowa | 49.56 | 50.44 | 0.94 | 0 | 0 | 0 |
| Illinois | 1.14 | 98.86 | 86.29 | 42.96 | 0.97 | 0 |
| Indiana | 5.31 | 94.69 | 53.75 | 15.39 | 2.52 | 0 |
| Kansas | 81.37 | 18.63 | 7.82 | 0 | 0 | 0 |
| Kentucky | 23.26 | 76.74 | 17.74 | 0.56 | 0 | 0 |
| Michigan | 38.35 | 61.65 | 41.7 | 8.36 | 0 | 0 |
| Minnesota | 42.81 | 57.19 | 12.46 | 0 | 0 | 0 |
| Montana | 21.85 | 78.15 | 45.03 | 31.81 | 8.55 | 0 |
| North Dakota | 92.16 | 7.84 | 0 | 0 | 0 | 0 |
| Nebraska | 63.38 | 36.62 | 9.08 | 0 | 0 | 0 |
| Ohio | 3.68 | 96.32 | 73.19 | 23.65 | 9.11 | 0 |
| South Dakota | 72.74 | 27.26 | 0.11 | 0 | 0 | 0 |
| Tennessee | 50.92 | 49.08 | 31.95 | 5.92 | 0 | 0 |
| Texas | 25.14 | 74.86 | 26.4 | 13 | 3.81 | 0.29 |
| Wisconsin | 30.84 | 69.16 | 6.12 | 0 | 0 | 0 |

