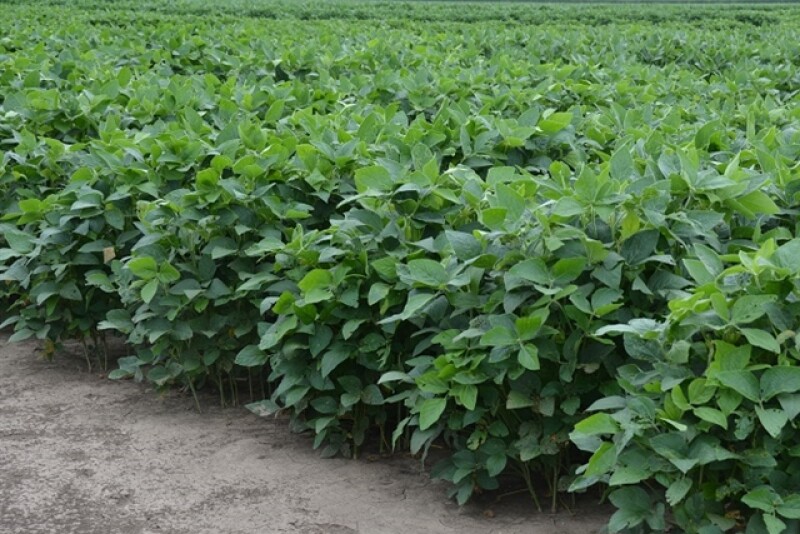
USDA rated the corn crop as 71% “good” to “excellent” and 8% “poor” to “very poor,” the soybean crop 69% “good” to “excellent” and 8% “poor” to “very poor” and the spring wheat crop 49% “good” to “excellent” and 18% “poor” to “very poor.”
On the weighted Pro Farmer Crop Condition Index (CCI; 0 to 500-point scale, with 500 representing perfect), the corn crop declined 0.8 points to 381.6. and the soybean crop decreased 1.6 points to 373.7. The spring wheat rating decreased 2.4 points, reversing slight increases over the prior two weeks. Variability in protein content has been reported in spring wheat crops, especially in North Dakota. Corn and soybean ratings continue to hold up, bucking the usual trend of more sharply declining conditions over the month of August.
Pro Farmer Crop Condition Index for Corn | |||
| State | This Week | Last week | Year-ago |
| Colorado (0.86%*) | 3.02 | 2.91 | 2.60 |
| Illinois (15.63%) | 55.96 | 57.06 | 57.55 |
| Indiana (6.96%) | 25.06 | 25.06 | 26.32 |
| Iowa (17.37%) | 70.88 | 71.58 | 66.92 |
| Kansas (4.27%) | 15.24 | 15.36 | 13.67 |
| Kentucky (1.63%) | 5.73 | 5.79 | 6.33 |
| Michigan (2.32%) | 8.12 | 7.84 | 9.00 |
| Minnesota (9.85%) | 38.41 | 38.21 | 35.61 |
| Missouri (3.80%) | 14.89 | 14.82 | 14.17 |
| Nebraska (11.37%) | 45.60 | 45.37 | 43.05 |
| North Carolina (0.69%) | 2.73 | 2.74 | 1.57 |
| North Dakota (3.26%) | 11.51 | 11.64 | 10.64 |
| Ohio (4.18%) | 15.22 | 14.64 | 14.08 |
| Pennsylvania (0.66%) | 2.63 | 2.70 | 2.49 |
| South Dakota (5.47%) | 21.61 | 21.61 | 19.27 |
| Tennessee (0.81%) | 2.88 | 2.89 | 3.11 |
| Texas (1.41%) | 5.27 | 5.27 | 4.54 |
| Wisconsin (3.66%) | 14.72 | 14.72 | 13.82 |
| Corn total | 381.58 | 382.36 | 368.10 |
* denotes percentage of total national corn crop production.
Pro Farmer Crop Condition Index for Soybeans | |||
| State | This Week | Last week | Year-ago |
| Arkansas (3.82%*) | 14.13 | 14.01 | 14.32 |
| Illinois (15.74%) | 55.55 | 56.65 | 56.24 |
| Indiana (7.90%) | 28.42 | 28.50 | 29.46 |
| Iowa (13.73%) | 54.10 | 54.92 | 54.18 |
| Kansas (3.03%) | 11.16 | 11.34 | 11.61 |
| Kentucky (2.32%) | 8.03 | 8.42 | 8.36 |
| Louisiana (1.18%) | 4.74 | 4.61 | 4.40 |
| Michigan (2.38%) | 8.48 | 8.25 | 8.67 |
| Minnesota (8.19%) | 31.70 | 31.70 | 30.18 |
| Mississippi (2.38%) | 8.87 | 9.03 | 8.72 |
| Missouri (6.45%) | 24.52 | 24.46 | 24.11 |
| Nebraska (6.60%) | 26.41 | 26.08 | 26.36 |
| North Carolina (1.48%) | 5.68 | 5.68 | 4.98 |
| North Dakota (5.18%) | 18.33 | 18.43 | 16.80 |
| Ohio (6.31%) | 22.97 | 22.47 | 21.42 |
| South Dakota (5.06%) | 19.87 | 19.82 | 18.36 |
| Tennessee (1.82%) | 5.96 | 6.06 | 6.13 |
| Wisconsin (2.52%) | 10.17 | 10.14 | 9.59 |
| Soybean total | 373.65 | 375.20 | 368.30 |
* denotes percentage of total national soybean production.
Pro Farmer Crop Condition Index for HRS Wheat | |||
| State | This Week | Last week | Year-ago |
| Idaho (6.57%*) | 22.75 | 21.34 | 24.50 |
| Minnesota (15.24%) | 61.38 | 59.29 | 61.54 |
| Montana (13.14%) | 32.01 | 31.81 | 45.46 |
| North Dakota (54.94%) | 197.38 | 203.82 | 207.54 |
| South Dakota (6.10%) | 21.39 | 21.77 | 22.83 |
| Washington (4.01%) | 11.15 | 10.44 | 13.17 |
| HRS total | 346.06 | 348.46 | 375.04 |
* denotes percentage of total national HRS crop production.

