Corn, soybean CCI ratings continue late-season deterioration
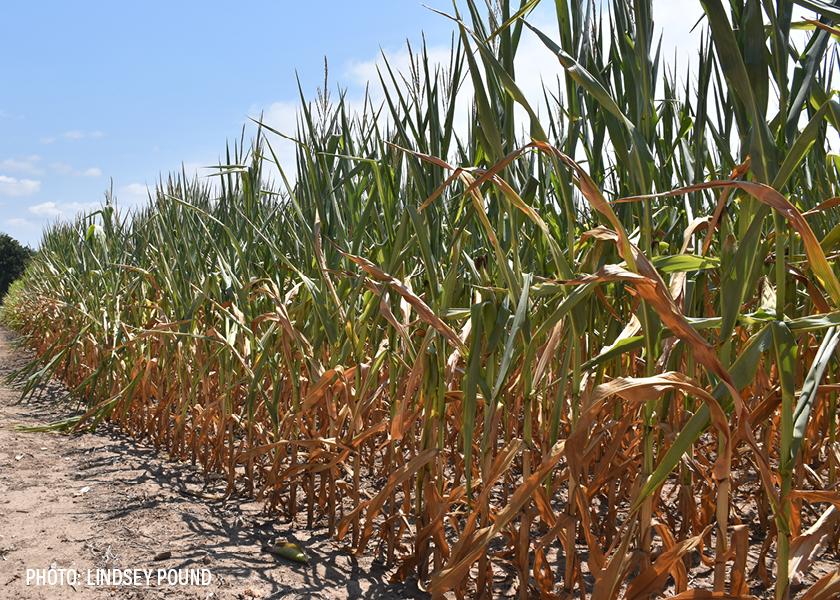
When USDA’s weekly condition ratings are plugged into the weighted Pro Farmer Crop Condition Index (CCI; 0 to 500-point scale, with 500 representing perfect), the corn crop dropped 3.2 points to 332.9, which was 4.0 points (1.2%) below year-ago at this point. The soybean crop declined 2.1 points to 331.3, down 7.6 points (2.3%) from last year in mid-September. Illinois accounted for the bulk of the decline for both crops over the past week.
|
Pro Farmer Crop Condition Index for Corn |
|||
|
|
This Week |
Last week |
Year-ago |
|
Colorado (0.91%*) |
3.05 |
3.28 |
2.58 |
|
Illinois (15.33%) |
50.45 |
53.05 |
54.33 |
|
Indiana (6.95%) |
25.03 |
25.10 |
22.67 |
|
Iowa (17.02%) |
56.67 |
56.16 |
63.20 |
|
Kansas (4.72%) |
13.51 |
13.61 |
13.09 |
|
Kentucky (1.72%) |
6.60 |
6.53 |
5.40 |
|
Michigan (2.30%) |
8.23 |
8.19 |
7.46 |
|
Minnesota (9.98%) |
31.73 |
31.43 |
34.79 |
|
Missouri (3.75%) |
10.46 |
10.61 |
11.93 |
|
Nebraska (11.86%) |
38.31 |
38.67 |
36.81 |
|
North Carolina (0.79%) |
2.95 |
2.95 |
2.16 |
|
North Dakota (2.28%) |
8.21 |
8.28 |
8.70 |
|
Ohio (4.20%) |
16.26 |
16.77 |
13.28 |
|
Pennsylvania (0.99%) |
3.96 |
3.90 |
3.84 |
|
South Dakota (4.93%) |
16.03 |
15.88 |
14.08 |
|
Tennessee (0.94%) |
3.63 |
3.61 |
2.96 |
|
Texas (1.45%) |
4.75 |
4.75 |
4.21 |
|
Wisconsin (3.71%) |
12.54 |
12.58 |
13.80 |
|
Corn total |
332.90 |
336.06 |
336.90 |
* denotes percentage of total national corn crop production.
|
Pro Farmer Crop Condition Index for Soybeans |
|||
|
|
This Week |
Last week |
Year-ago |
|
Arkansas (3.58%*) |
13.89 |
13.82 |
12.35 |
|
Illinois (15.24%) |
50.61 |
53.20 |
54.74 |
|
Indiana (7.81%) |
28.03 |
28.11 |
26.70 |
|
Iowa (13.31%) |
44.59 |
43.79 |
48.47 |
|
Kansas (4.01%) |
10.37 |
10.49 |
11.83 |
|
Kentucky (2.34%) |
8.77 |
8.77 |
7.79 |
|
Louisiana (1.28%) |
3.83 |
3.81 |
3.32 |
|
Michigan (2.47%) |
8.73 |
8.63 |
8.26 |
|
Minnesota (8.45%) |
27.97 |
27.80 |
30.69 |
|
Mississippi (2.47%) |
8.90 |
8.75 |
8.03 |
|
Missouri (6.55%) |
20.90 |
20.90 |
21.99 |
|
Nebraska (7.17%) |
22.79 |
22.57 |
23.25 |
|
North Carolina (1.47%) |
5.17 |
5.20 |
5.25 |
|
North Dakota (4.43%) |
14.39 |
14.79 |
16.05 |
|
Ohio (6.41%) |
24.23 |
24.75 |
21.73 |
|
South Dakota (4.90%) |
16.16 |
15.97 |
14.99 |
|
Tennessee (1.81%) |
1.00 |
1.00 |
1.00 |
|
Wisconsin (2.57%) |
8.52 |
8.57 |
9.58 |
|
Soybean total |
331.26 |
333.40 |
338.89 |
* denotes percentage of total national soybean production.