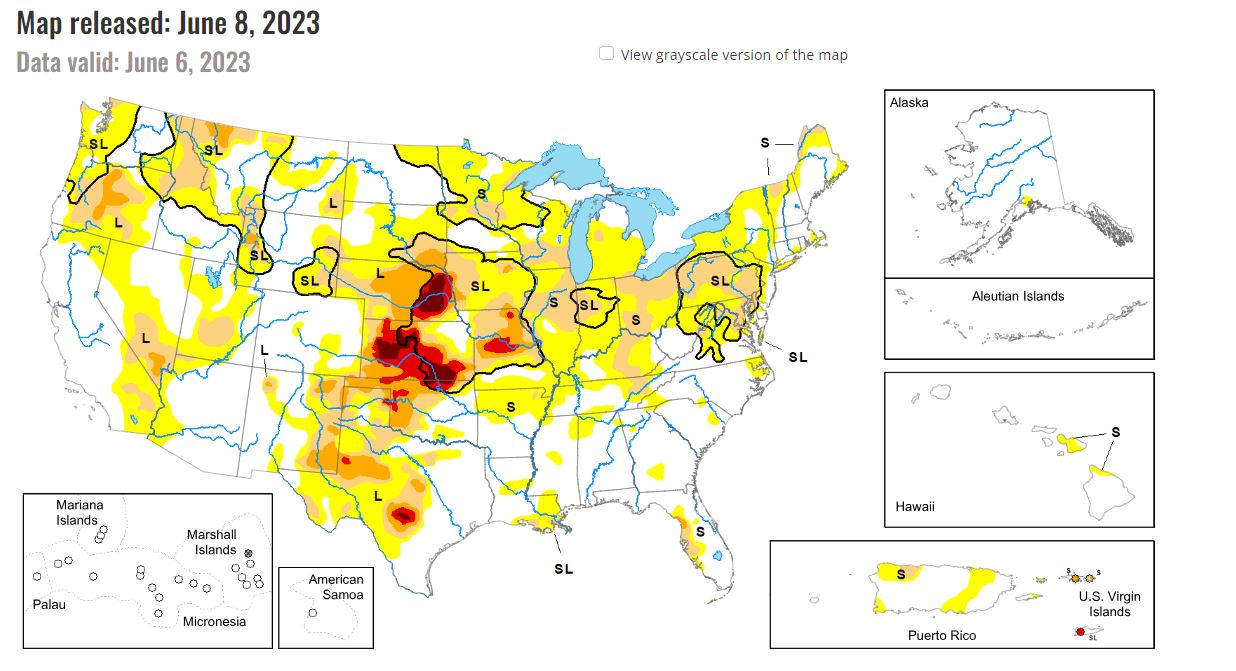
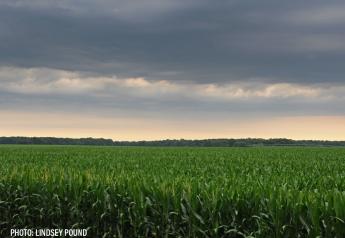
Dryness/drought now covers most of Corn Belt
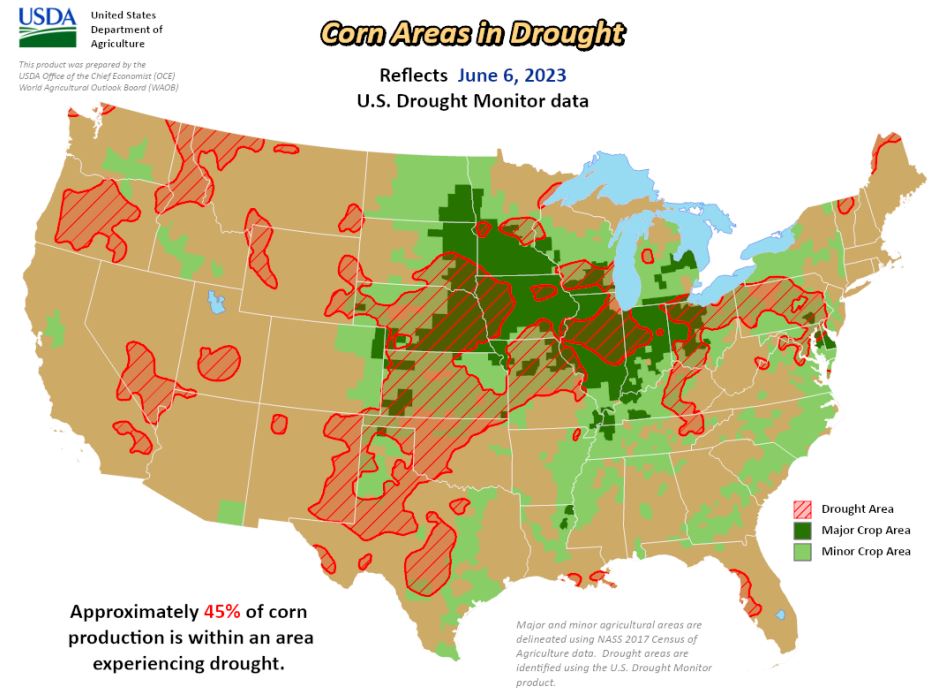
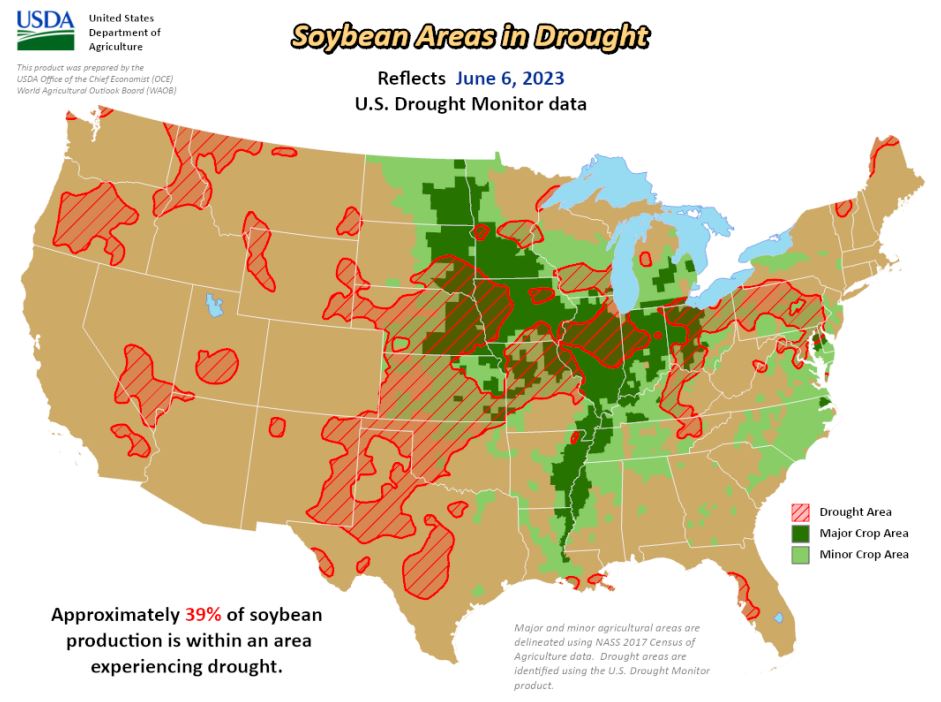
As of June 6, the Drought Monitor showed 55% of the U.S. was covered by abnormal dryness/drought, up five percentage points from the previous week. USDA estimated drought covered 45% of corn production areas (up 11 points from last week), 39% of soybeans (up 11 points), 5% of spring wheat (down one point) and 19% of cotton areas (down nine points).
The Drought Monitor noted: “Heavy rains fell this week across some of the western parts of the Central and Southern Great Plains, especially in the Texas Panhandle and western Oklahoma and Kansas, leading to widespread improvements to ongoing drought in the western Great Plains. Heavy rains in the central and southern Florida Peninsula also led to improvements to ongoing drought and abnormal dryness in the southwest Florida Peninsula. Widespread degradations occurred in the Midwest.”
For the Midwest, the Drought Monitor stated: “Localized heavier rains (exceeding 2 inches in spots) fell across the western reaches of the Midwest region, though large swaths of drier-than-normal weather occurred here. Farther east, in Kentucky and the Great Lakes states, mostly or completely dry weather occurred this week, which led to mounting short-term precipitation deficits and worsening streamflows and soil moisture values. Unusually warm temperatures, reaching or exceeding 9 degrees above normal in large portions of Michigan, Wisconsin and Minnesota, also contributed to worsening dryness. Large-scale additions and expansions of abnormal dryness and moderate drought occurred, especially along and east of the Mississippi River and in central Minnesota, where the combination of precipitation deficits, low streamflow and declining soil moisture was most prevalent. Due to similar conditions along the Missouri River in western Iowa, some expansions were made to severe drought there.”
Click here for additional information and related maps.