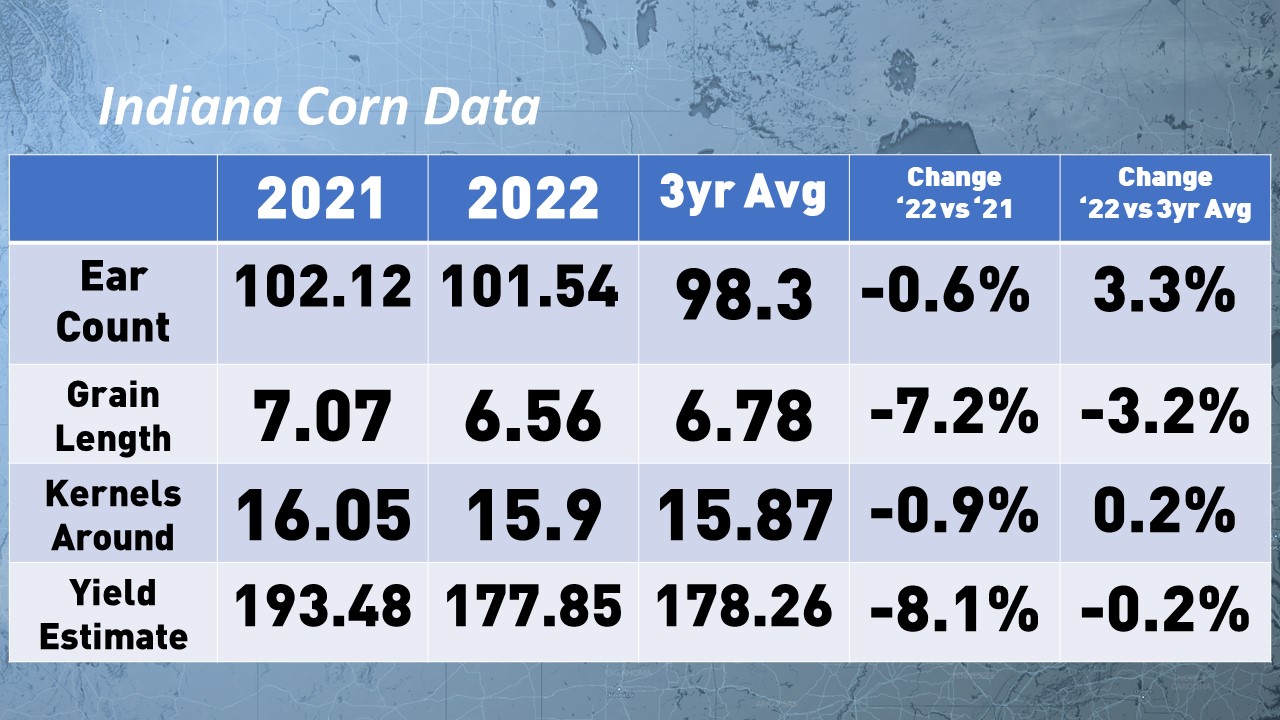
2022 Crop Tour results: Indiana

2022 Pro Farmer Crop Tour:
|
||||||
|
District |
Ear Count in 60 ft of Row |
Grain Length |
Kernel Rows Around |
Row Spacing |
Yield |
Samples |
|
IN 1 |
103.19 |
6.76 |
15.92 |
29.78 |
185.75 |
36 |
|
IN 2 |
95.50 |
7.00 |
16.39 |
29.54 |
185.54 |
26 |
|
IN 3 |
100.81 |
6.47 |
15.78 |
30.00 |
171.76 |
31 |
|
IN 4 |
104.43 |
6.04 |
16.07 |
29.13 |
173.54 |
23 |
|
IN 5 |
102.34 |
6.44 |
15.82 |
29.81 |
175.36 |
62 |
|
IN 6 |
101.64 |
6.65 |
15.65 |
29.74 |
176.79 |
39 |
|
IN Average |
101.54 |
6.56 |
15.90 |
29.71 |
177.85 |
217 |
2021 Indiana Corn Results |
||||||
|
District |
Ear Count in 60 ft of Row |
Grain Length |
Kernel Rows Around |
Row Spacing |
Yield |
Samples |
|
IN 1 |
102.56 |
6.67 |
15.85 |
30.00 |
180.63 |
25 |
|
IN 2 |
94.61 |
6.95 |
16.01 |
29.57 |
179.06 |
23 |
|
IN 3 |
102.38 |
7.15 |
16.14 |
29.69 |
197.94 |
32 |
|
IN 4 |
100.63 |
7.27 |
16.32 |
29.85 |
200.49 |
27 |
|
IN 5 |
104.31 |
7.23 |
16.09 |
30.00 |
200.87 |
58 |
|
IN 6 |
104.37 |
6.89 |
15.81 |
30.00 |
189.86 |
30 |
|
IN Average |
102.12 |
7.07 |
16.05 |
29.88 |
193.48 |
195 |
Three-year Average for Indiana Corn (2019-2021) |
||||||
|
District |
Ear Count in 60 ft of Row |
Grain Length |
Kernel Rows Around |
Row Spacing |
Yield |
Samples |
|
IN 1 |
98.52 |
6.76 |
15.98 |
29.86 |
178.65 |
25 |
|
IN 2 |
96.71 |
6.59 |
15.73 |
29.86 |
167.85 |
22 |
|
IN 3 |
97.38 |
6.94 |
15.82 |
29.76 |
179.46 |
26 |
|
IN 4 |
98.08 |
6.81 |
16.08 |
29.10 |
185.29 |
27 |
|
IN 5 |
99.60 |
6.82 |
15.88 |
29.76 |
181.26 |
53 |
|
IN 6 |
98.12 |
6.73 |
15.72 |
29.90 |
173.53 |
32 |
|
IN Average |
98.30 |
6.78 |
15.87 |
29.71 |
178.26 |
185 |
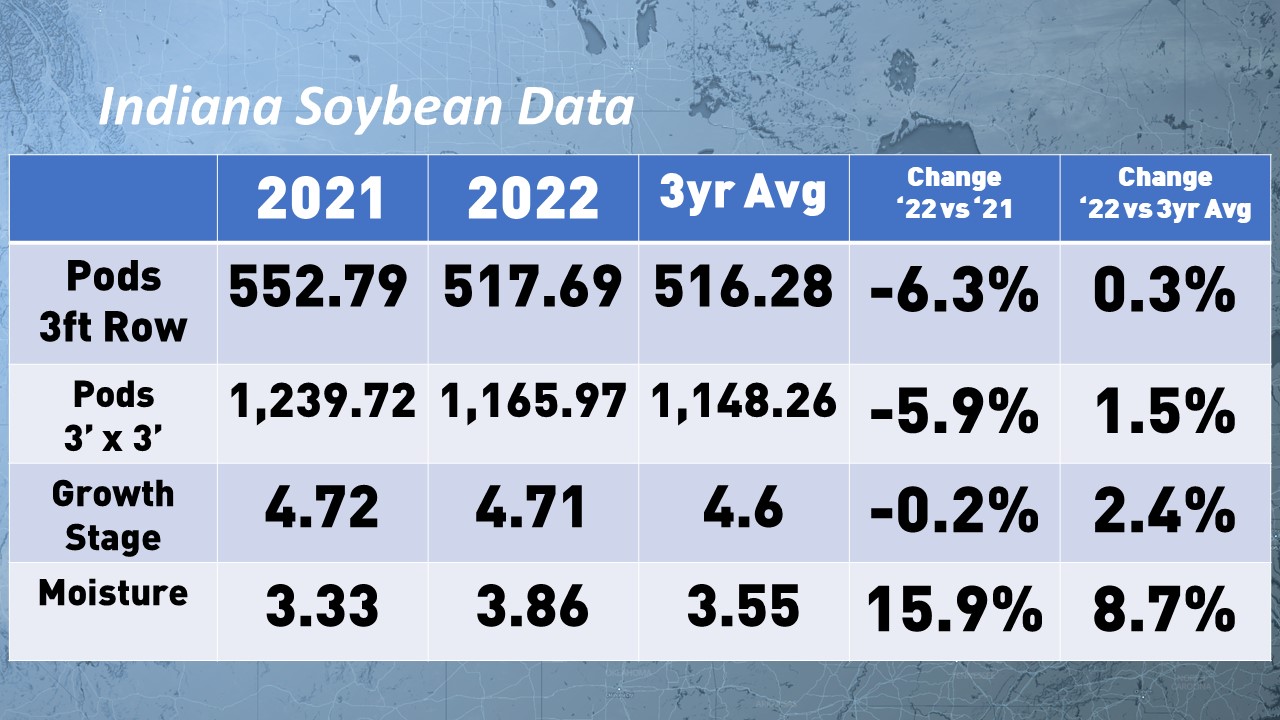
2022 Pro Farmer Crop Tour:
|
||||||
|
District |
Pod Count in 3’ |
Soil Moisture |
Growth Stage |
Row Spacing |
Pod Count in 3’X3’ Square |
Samples |
|
IN 1 |
601.04 |
4.28 |
4.86 |
18.01 |
1288.91 |
36 |
|
IN 2 |
513.80 |
3.62 |
4.81 |
17.40 |
1122.84 |
26 |
|
IN 3 |
434.89 |
4.41 |
4.56 |
15.63 |
991.65 |
32 |
|
IN 4 |
486.81 |
3.26 |
4.70 |
14.89 |
1200.76 |
23 |
|
IN 5 |
541.25 |
3.69 |
4.77 |
16.85 |
1183.80 |
62 |
|
IN 6 |
491.37 |
3.79 |
4.55 |
15.79 |
1175.63 |
38 |
|
IN Average |
517.69 |
3.86 |
4.71 |
16.54 |
1165.97 |
217 |
2021 Indiana Soybeans Results |
||||||
|
District |
Pod Count in 3’ |
Soil Moisture |
Growth Stage |
Row Spacing |
Pod Count in 3’X3’ Square |
Samples |
|
IN 1 |
575.07 |
3.31 |
4.86 |
19.48 |
1140.26 |
29 |
|
IN 2 |
591.73 |
3.38 |
4.73 |
16.06 |
1329.71 |
26 |
|
IN 3 |
538.76 |
4.41 |
4.56 |
16.08 |
1282.47 |
32 |
|
IN 4 |
593.49 |
3.22 |
4.59 |
17.78 |
1245.81 |
27 |
|
IN 5 |
541.49 |
2.82 |
4.80 |
16.03 |
1234.00 |
56 |
|
IN 6 |
485.76 |
3.16 |
4.72 |
14.58 |
1213.04 |
25 |
|
IN Average |
552.79 |
3.33 |
4.72 |
16.61 |
1239.72 |
195 |
Three-year Average for Indiana Soybeans (2019-2021) |
||||||
|
District |
Pod Count in 3 feet |
Soil Moisture |
Growth Stage |
Row Spacing |
Pod Count in 3’X3’ Square |
Samples |
|
IN 1 |
598.86 |
3.49 |
4.71 |
18.69 |
1187.43 |
26 |
|
IN 2 |
549.58 |
3.46 |
4.59 |
17.58 |
1180.52 |
23 |
|
IN 3 |
451.00 |
3.85 |
4.40 |
16.00 |
1084.70 |
26 |
|
IN 4 |
524.35 |
3.70 |
4.71 |
16.73 |
1143.54 |
28 |
|
IN 5 |
506.13 |
3.54 |
4.59 |
16.23 |
1137.24 |
53 |
|
IN 6 |
482.59 |
3.30 |
4.58 |
15.49 |
1150.41 |
31 |
|
IN Average |
516.28 |
3.55 |
4.60 |
16.63 |
1148.26 |
186 |